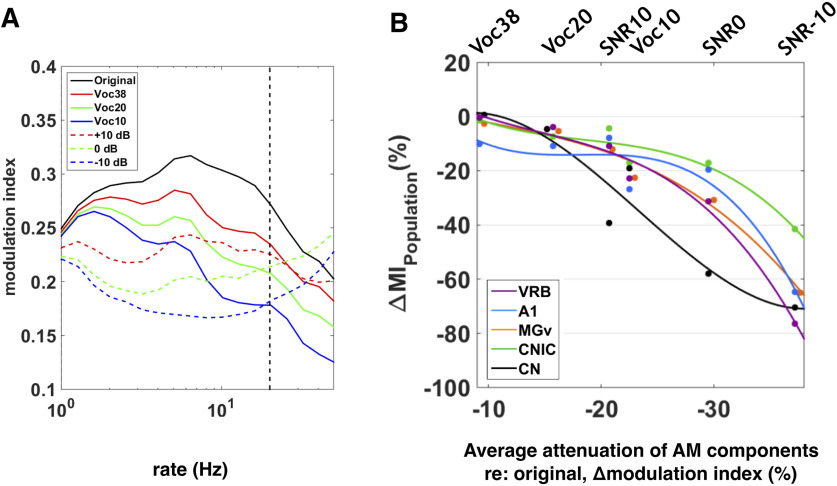
Figure 12.
Reduction of slow AM cues as one of the factors explaining the neuronal discrimination performance at the subcortical and cortical levels. A, Vocoding and noise effects on the AM spectra. The plot represents the averaged modulation spectra of the four original vocalizations (in black), vocoded vocalizations (Voc38, Voc20, and Voc10: red, green, and blue, respectively, solid lines), and vocalizations in noise at three SNRs (+10, 0, and −10 dB: red, green, and blue respectively, dashed lines). Vertical black dashed line corresponds to the maximum frequency (20 Hz) selected for the data analysis. B, Percentage of ΔMIPopulation as a function of Δmodulation index computed for each structure from mean MIPopulation or mean modulation index values obtained in all adverse conditions and mean values in the original condition. Each dot represents neuronal data (ΔMIPopulation) in CN (in black), CNIC (in green), MGv (in orange), A1 (in blue), and VRB (in purple). Polynomial curves fitting all acoustic conditions have been generated (color lines). In all conditions (vocoding or noise), there is a limit of AM reduction from which the ΔMIPopulation decreases in cortical and subcortical structures.

