Figure 4.
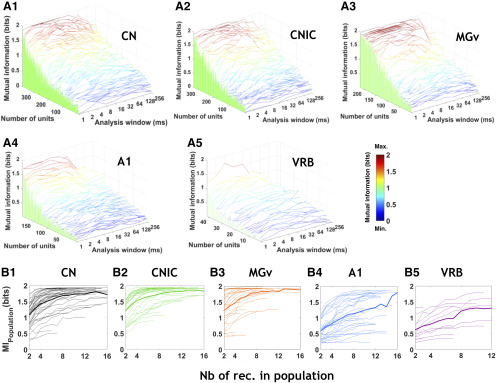
Diversity of neuronal discrimination performance in quiet for each structure at the individual and population levels. A1–A5, Neural discrimination performance in response to original vocalizations in each auditory structure. Waterfall plots show the MI (bits) as a function of temporal resolution (1–256 ms) for the selected recordings in CN (A1), CNIC (A2), MGv (A3), A1 (A4), and VRB (A5). In each structure, the units are ranked by the mean MI value obtained for all bin sizes. Note that there was a larger proportion of neurons with high values of MI (close from the maximal value of 2 bits) in MGv, CNIC, and CN (red curves) compared with a much lower proportion in the cortical areas A1 and VRB. B1–B5, Population information quickly reaches high values with simultaneous multiunit recordings at the subcortical level but not the cortical level. For each auditory structure, each thin line represents a particular case of simultaneous recording with a maximum number of electrodes (maximum of 16 simultaneous multiunit recordings), and each thick line represents the mean value of MIPopulation in CN (B1, in black), CNIC (B2, in green), MGv (B3, in orange), A1 (B4, in blue), and VRB (B5, in purple). Note that the mean MIPopulation value quickly reaches high values close to the maximum value of 2 bits in the subcortical structures (CN, CNIC, and MGv) compared with the two cortical areas (A1 and VRB).

