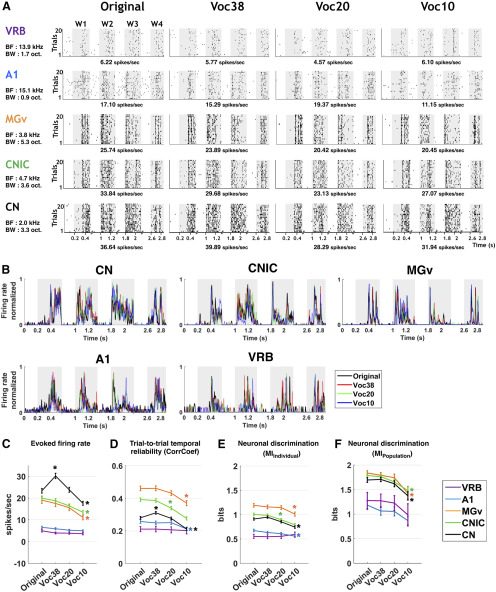
Figure 6.
Vocoding slightly alters neuronal responses at each stage of the auditory system. A, From left to right, examples of raster plots representing the responses to the four original whistles (Original) and their vocoded versions (Voc38, Voc20, and Voc10). The gray part of rasters corresponds to evoked activity. From bottom to top, Neuronal responses were recorded in CN, CNIC, MGv, A1, and VRB. For each example, the values of the BF (in kHz) and of the BW (in octaves) obtained when testing the responses to pure tones are indicated on the left side. For each example, the mean evoked firing rate (in spikes/s) obtained in each condition is indicated below the rasters. B, PSTHs of each neuronal response presented in A. For each neuronal recording, the four PSTHs of the original and vocoded conditions have been overlayed. The gray part of the PSTHs corresponds to evoked activity. C–F, The mean values (±SEM) represent the vocoding effects on the evoked firing rate (in spikes/s; C), the temporal reliability represented by the CorrCoef value (D), the neuronal discrimination assessed by MIIndividual (in bits; E), and MIPopulation (in bits; F) with populations of nine simultaneous multiunit recordings in CN (in black), CNIC (in green), MGv (in orange), A1 (in blue), and VRB (in purple; one-way ANOVA, p < 0.05; with post hoc paired t tests, *p < 0.05). The evoked firing rate corresponds to the total number of action potentials occurring during the presentation of the stimulus minus spontaneous activity (200 ms before each acoustic stimulus). At the population level, the discrimination performance significantly decreased only for 10 frequency bands in subcortical structures and did not decrease in cortical areas.

