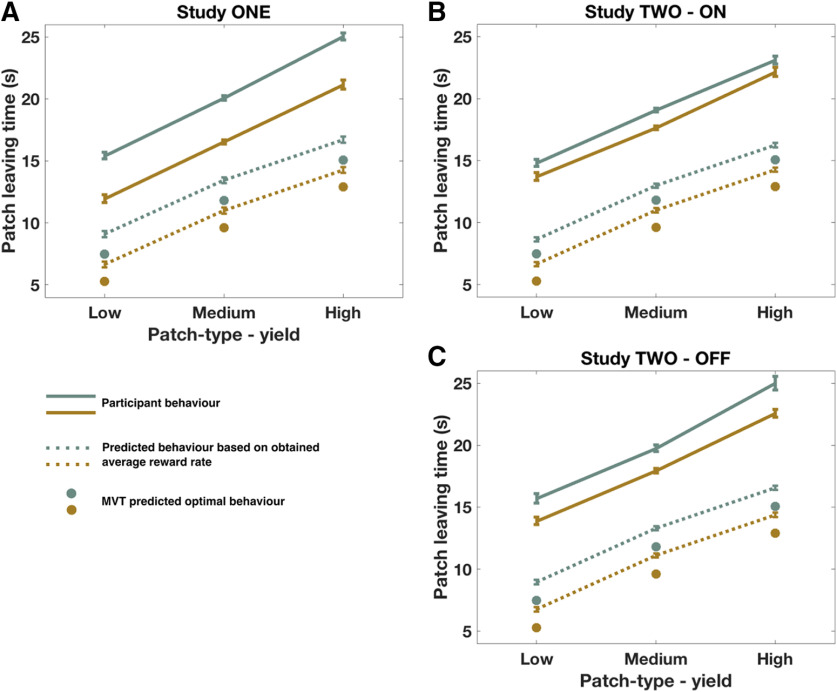
Figure 4.
Patch-leaving times: observed, and predicted based on MVT. A–C, Although predicted leaving times based on actual long-run background reward rate were later than optimally predicted by MVT, actual leaving times were still significantly later. Dots represent MVT predicted optimal leaving time. Dotted lines indicate predictions based on actual long-run background reward rate. Lines indicate actual behavior. Green represents poor environment. Gold represents rich environment.

