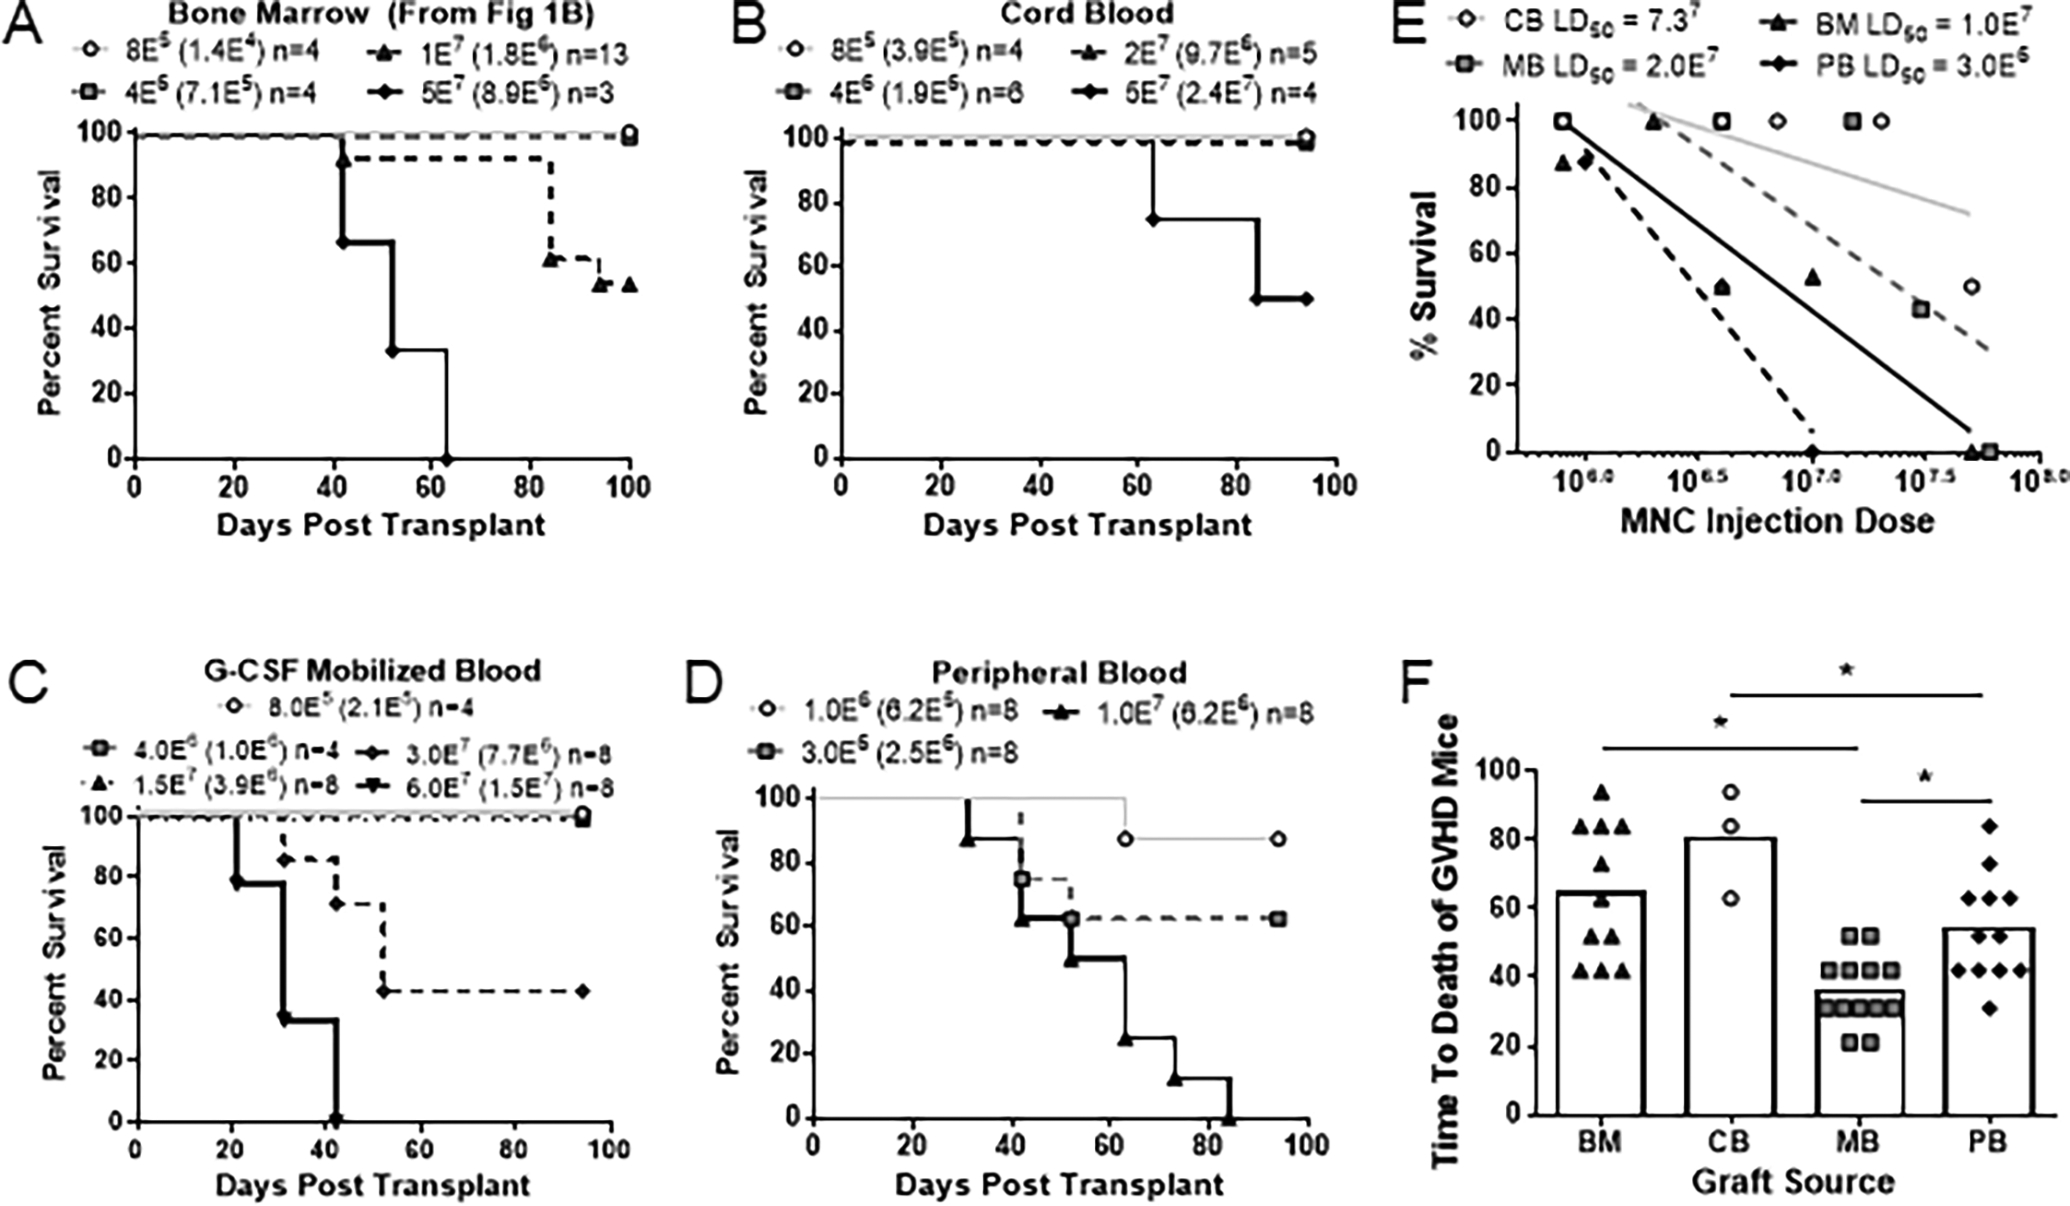
Figure 6. Distinct GVHD-potential of different graft tissue sources.

(A-D) Kaplan-Meier survival frequencies over a 100-day period of mice transplanted with the following tissues: (A) human bone marrow (note that this is the same plot as Figure 1B, and is repeated here to facilitate comparison with other tissue grafts), (B) umbilical cord blood, (C) G-CSF mobilized blood, or (D) peripheral blood. Symbol legends show total number of mononuclear cells transplanted, with the number of T cells within each dose shown in parentheses. (E) Calculated LD50 values for each HSCT graft source. (F) Graph showing the average time to death of each graft source irrespective of dosage. (G) Relative frequency of T cells, B cells, myeloid cells and HSPCs in the mononuclear fraction of each respective graft source. (H) Relative frequency of CD4+, CD8+, double negative, naïve and memory T cells within the T cell population of each respective graft source. (G-H) Data aggregated from 3–13 different graft donors.
