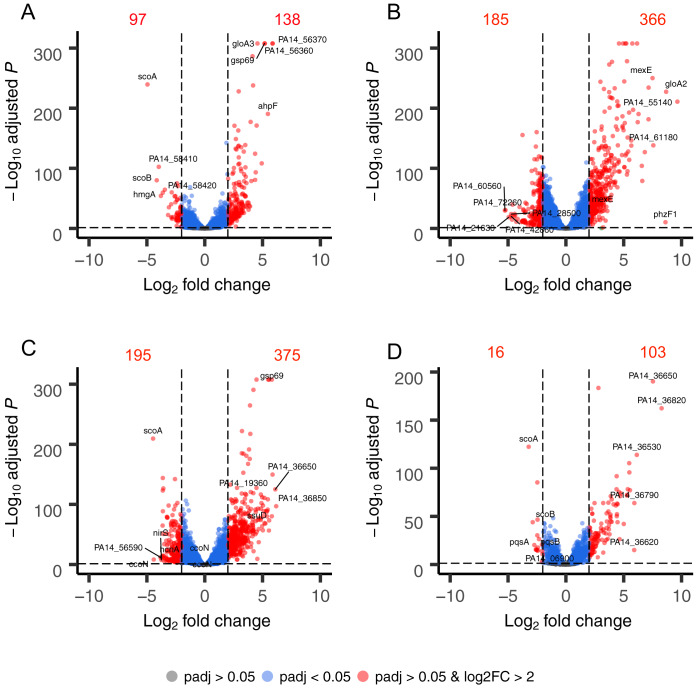
FIG 2.
Summary of genome-wide expression changes in P. aeruginosa PA14 after treatment with manuka honey (A); MGO (B); AHMGO (C); and AH (D). The top 10 most differentially expressed genes are labeled in each plot. Gray dots indicate genes with no significant difference compared to the untreated control (Padj > 0.05), blue dots indicate genes with a significant difference compared to the untreated control (Padj < 0.05), and red dots indicate genes with both a significant difference (Padj < 0.05) and log2FC of >2 compared to the untreated control, with numerical annotations to indicate the number of differentially expressed genes.

