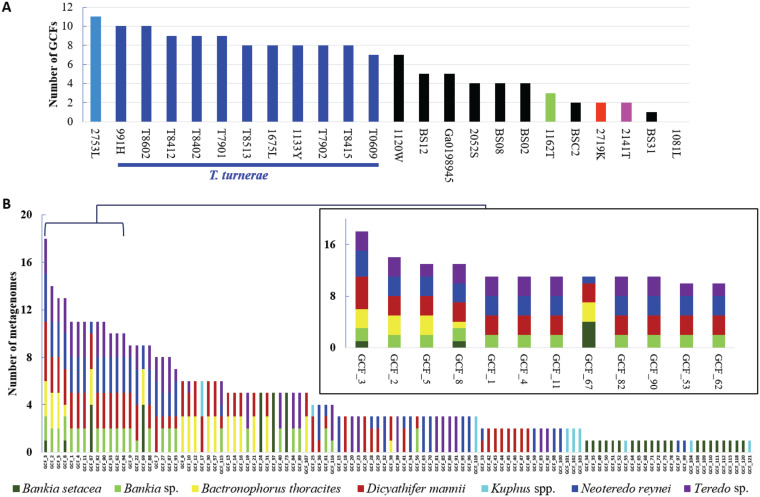
FIG 5.
GCFs found in (A) bacterial genomes and (B) gill metagenomes. (A) A list of strains of cultivated bacterial genomes is provided in the x axis, while the number of total GCFs in different sequenced strains is shown in the y axis. Colors indicate bacteria as described for Fig. 2A. Because there were 11 isolates of T. turnerae, the levels of GCFs in this group (dark blue bars) are comparatively overrepresented in the diagram. (B) GCFs (x axis) found in each metagenome (y axis) are shown. The inset expands a region containing the most common GCFs found in our specimens. Colors indicate shipworm host species. See Table S4 for a complete list of GCFs used in this figure.

