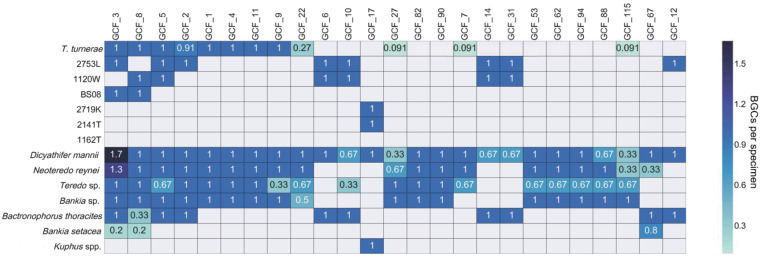
FIG 8.
Integration of tBLASTn and networking analyses reveals the pattern of occurrence of GCFs in isolates and metagenomes. Here, we show only the most commonly occurring GCFs. The values in each box indicate the number of BGC occurrences per specimen for each GCF (see Fig. S5 for details). When the number equals 1, then the BGC is found in all specimens of that species. When the number is less than 1, it then indicates the fraction of specimens in which the pathway is found. A number greater than 1 is specific to GCF_3, for which two different types are possible (see Fig. 8). In that case, there were two different classes of GCF_3 in two D. mannii specimens and one N. reynei specimen and only one class in the other specimens.

