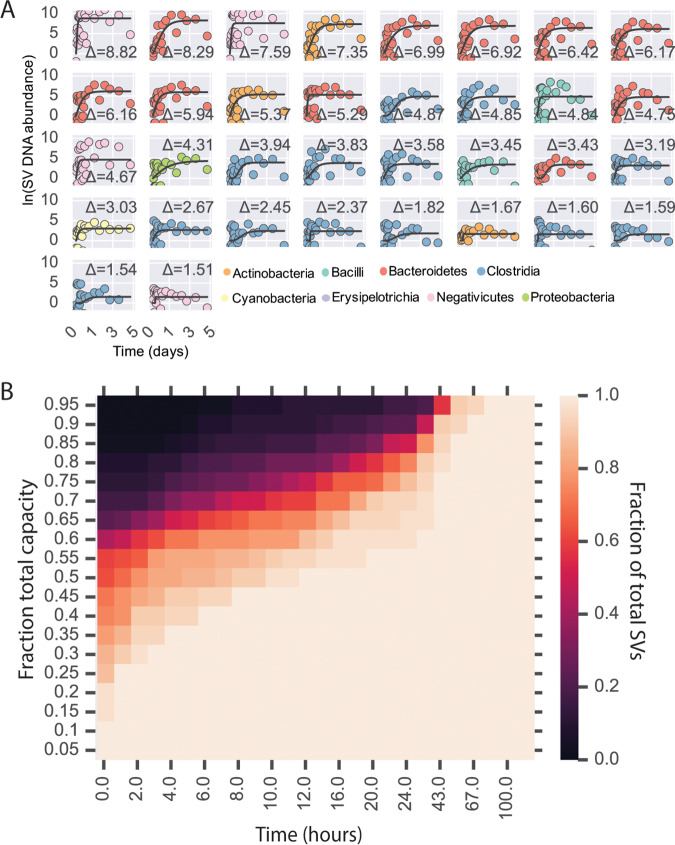
FIG 2.
SV growth kinetics in microfluidic droplets. (A) Abundance over time of SVs in MicDrop from a fresh human fecal sample. Levels of growth in replicate droplets were measured hourly for 24 h and daily for the ensuing days. Modified Gompertz growth curves are fitted to a time series (black lines). SVs are colored by taxonomy and sorted according to total growth (curve asymptote height; by an uppercase Greek delta [Δ]), which is denoted on each subplot. Only those SVs inferred to have doubled at least 2.14 times were considered to have been growing and are shown [ln(Δ SV DNA abundance) = ≥1.48; threshold determined using control experiments in Fig. S2]. To ease viewing, curves are shifted vertically such that the y intercepts are at the origin. (B) Fraction of SVs that had reached a given fraction of estimated carrying capacity over time. Carrying capacities were inferred from the fitted curves shown in panel A. By 43 h, 97% of SVs had reached 80% of their carrying capacity in droplets.

