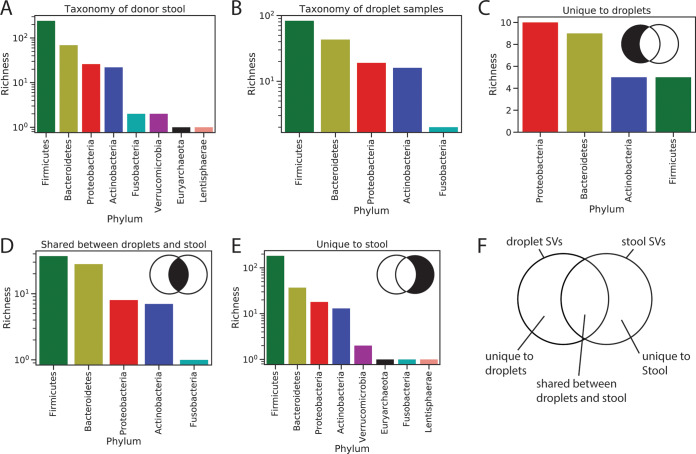
FIG 4.
Taxonomic distribution of donor stool and droplet samples used in MicDrop prebiotic assay. (A) Phylum-level counts of taxa found across 9 donor stool samples. (B) Phylum-level counts of taxa that grew in the prebiotic assay. (C to E) Phylum-level counts of SVs unique to droplet growth on the prebiotic assay (C), shared between droplet cultures and donor stool (D), or unique to donor stool samples (E). (F) Venn diagram of overlap of droplet and stool SVs (not scaled by SV number).

