. 2020 May 26;9:e52658. doi: 10.7554/eLife.52658

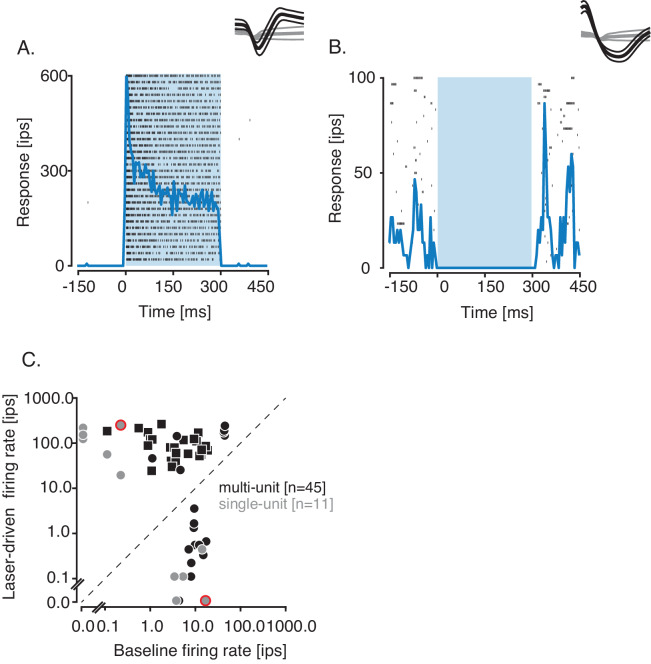
Figure 2. Optogenetic activation and suppression of single- and multi-units.

(A,B) Responses (in impulses per second, ips) of two example single units, aligned to the onset of optical stimulation, which lasted 300 ms (blue rectangle). Rasters (tick marks) and peristimulus time histograms (blue traces) are shown for an activated single unit (A) and a suppressed single unit (B). Insets: Mean spike waveform (thick black curve) and noise waveform (thick gray curve) ± 1 standard deviation (thin curves). (C) Scatter plot of firing rate on laser trials against baseline firing rate of units from monkey 2 (squares) and monkey 3 (circles). Data from example activated and suppressed units are circled in red. Firing rates were computed during optical stimulation or the equivalent epoch on control trials.

Figure 2.

Figure 2—figure supplement 1. Analysis of visually driven responses at activated and suppressed sites.
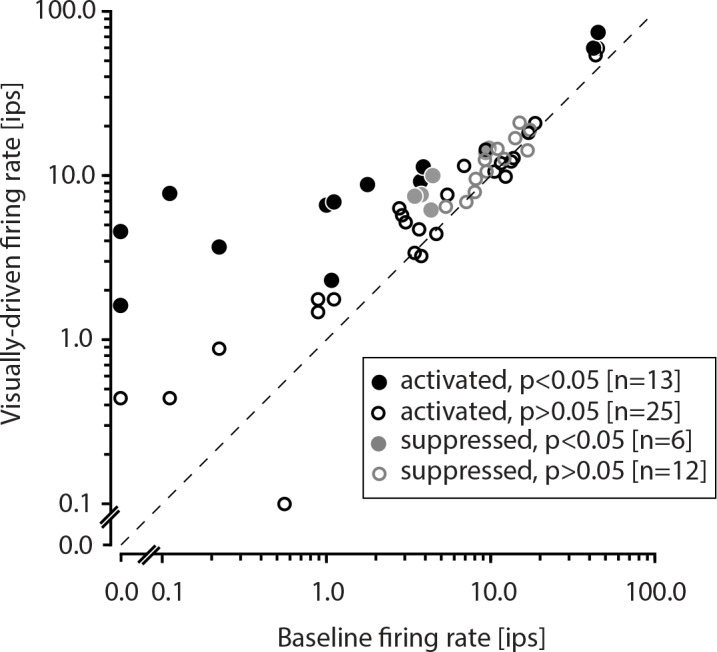
Figure 2—figure supplement 1.

Visually driven firing rate was computed during the Gabor stimulus presentation period (200 ms) and plotted against the baseline firing rate. A total of 46 sites were driven by visual stimuli. 19 of those were significantly visually driven.
Figure 2—figure supplement 2. Analysis of latency at activated and suppressed sites.
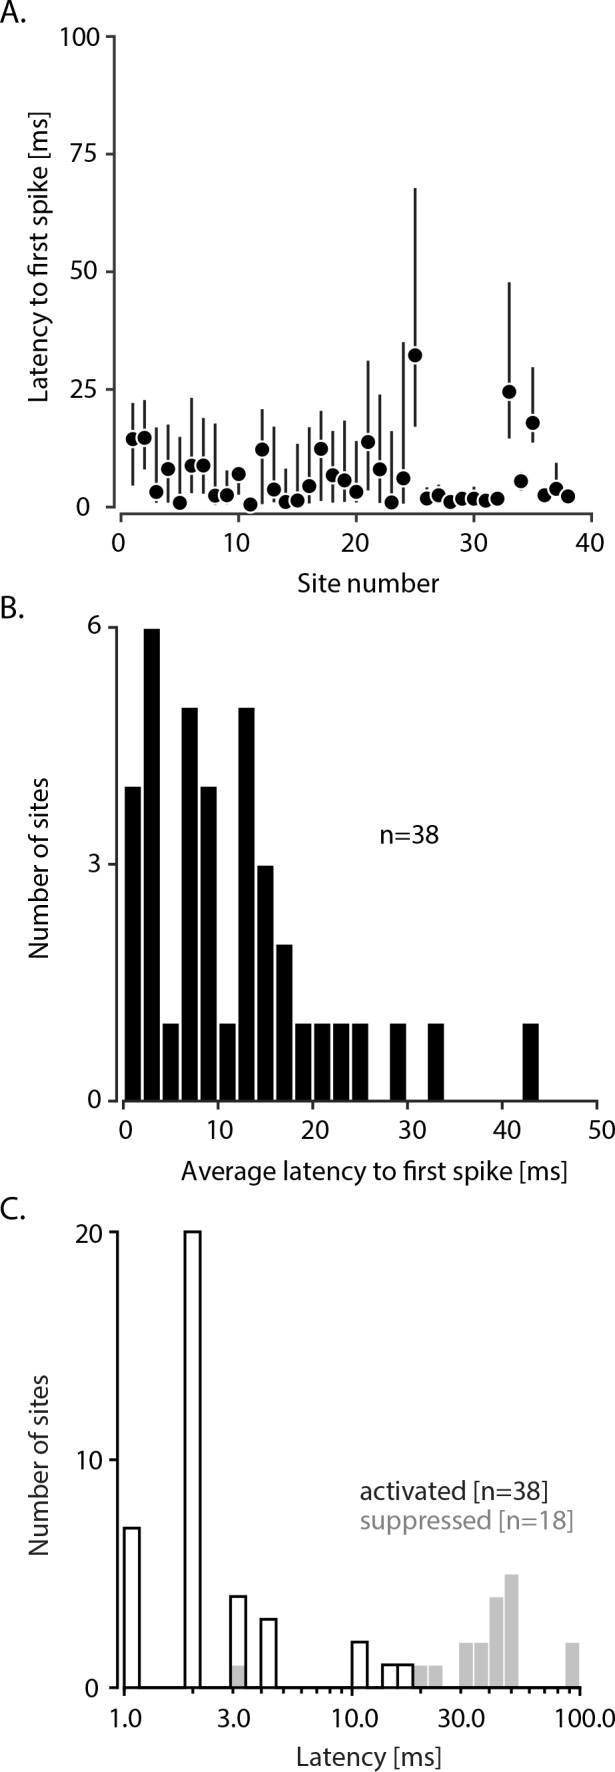
Figure 2—figure supplement 2.

(A) Analysis of latency to first spike at activated sites. Latency was defined as the time to first spike following optical stimulation on each trial. Black points represent medians across trials within a site, and the lower and the upper end of vertical black lines represent the 25th and 75th percentiles. (B) Histogram of average latencies to first spike following optogenetic activation. (C) Histogram of latencies at activated (black) and suppressed (gray) sites. For each site, firing rate was computed in a sliding 50-ms window from −50–150 ms after the laser was turned off. This firing rate was compared against the pre-laser firing rate (computed in a 50-ms window before optical stimulation). The time at which the firing rates in the two windows differed significantly was defined as the latency (p<0.05, Wilcoxon rank sum test).
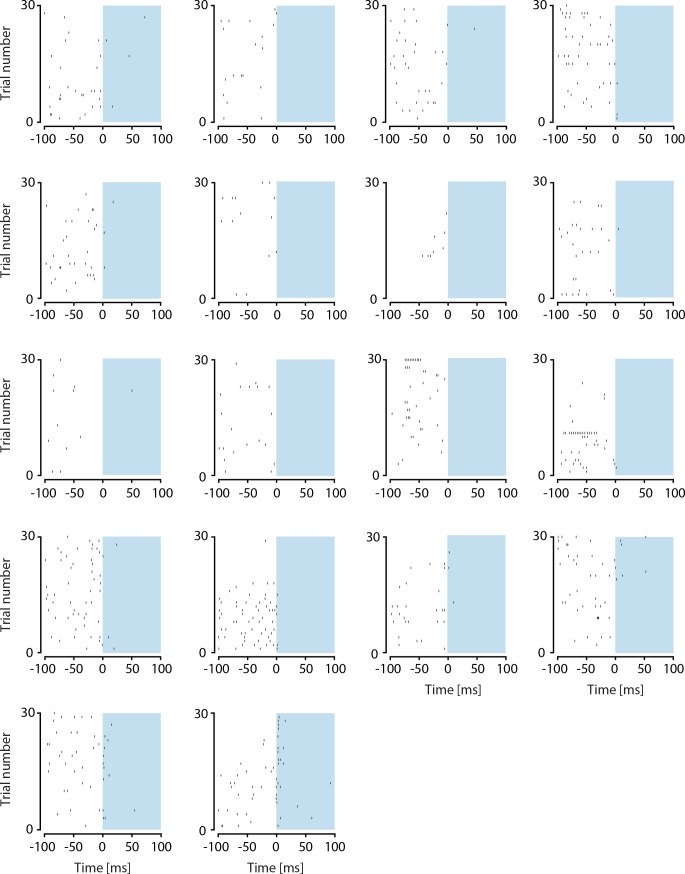
Figure 2—figure supplement 3. Rasters from all of the 18 suppressed sites.

Figure 2—figure supplement 3.

Responses are aligned to the onset of optical stimulation.