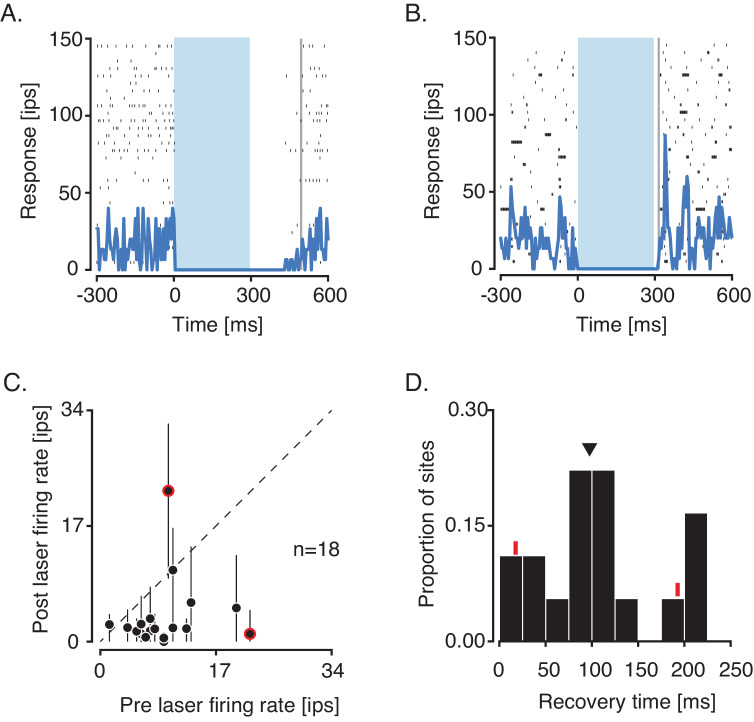
Figure 3. Analysis of activity rebound and recovery at suppressed sites.
(A) Responses of a single unit with a pre-laser firing rate that exceeded the post-laser firing rate. Recovery time to the baseline firing rate was 195 ms (vertical gray line). (B) Responses of another single unit with a post-laser firing rate that exceeded the pre-laser firing rate. Recovery time was 15 ms. (C) Scatter plot of pre-laser firing rates against post-laser firing rates. For each site, post-laser firing rate was computed in a sliding 50-ms window from 0 to 200 ms after the laser was switched off. The ranges of post-laser firing rates are plotted as black lines and averages are plotted as black points. Data from neurons in (A) and (B) are circled in red. (D) Histogram of recovery times following optogenetic suppression. Recovery times of example units are marked with red tick marks, and the median is marked with a triangle.

