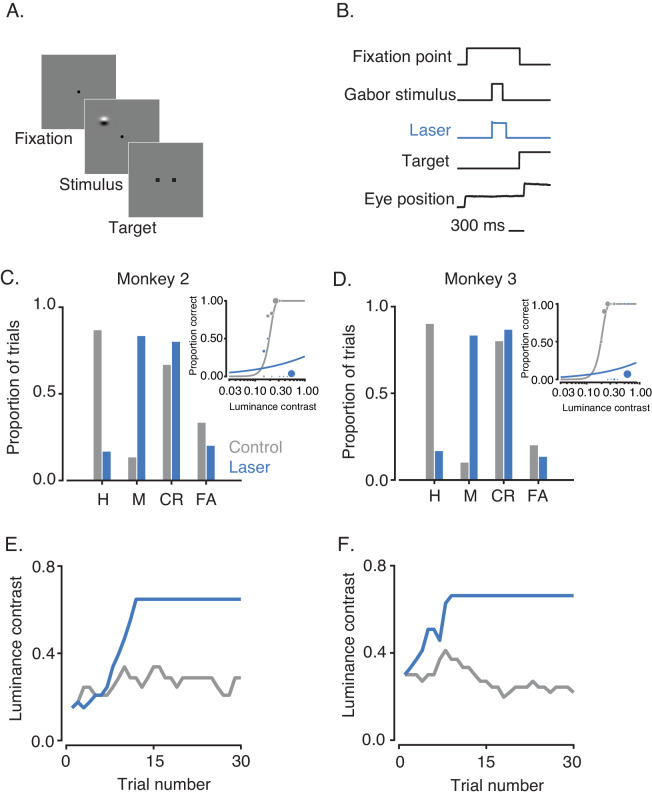
Figure 5. Effect of V1 inactivation on visual contrast detection.
(A) Task design. (B) Timing of events. (C) Performance of monkey 2 over one block of trials. Hits (H) and misses (M) are proportions of Gabor-present trials that were answered correctly and incorrectly, respectively. Correct rejections (CR) and false alarms (FA) are proportions of Gabor-absent trials that were answered correctly and incorrectly, respectively. Insets show psychometric functions on control (gray) and laser (blue) trials. Symbol size in insets reflects the number of trials that contributed to each data point. (E) Contrasts selected by the staircase procedure on control (gray) and laser (blue) trials. (D,F) Performance of monkey 3 in the same format as (C,E). Luminance contrast could not exceed 0.66 because the gray background was close to the upper limit of the display range.

