. 2020 May 26;9:e52658. doi: 10.7554/eLife.52658

Figure 8. Effect of laser power and repeated optical stimulation on contrast detection.

(A) Contrast values selected by the staircase procedure on laser trials (solid lines) and interleaved control trials (dashed lines) across seven blocks. (B) The difference in d’ between control and laser trials as a function of laser power calculated from the data in (A). A Naka-Rushton fit to the data is shown in black. (C) Differences in d’ between control and laser trials as a function of trial number in each session. Each session consisted of at least five blocks of 120 trials. The duration of an individual trial was 2.80 ± 0.51 s (mean ± SD), and the number of trials per session was 813 ± 253. Points are means and error bars are standard error of the mean (SEM). SEM was not plotted for the final two points, each of which represent data from a single session. (D) Scatter plot of the differences in d’ for early trials (1–480) vs. late trials (480–beyond) within each session.

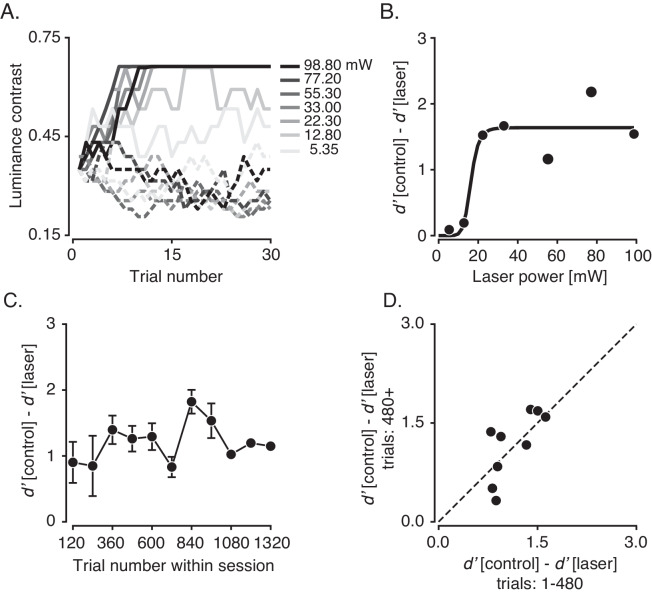
Figure 8.

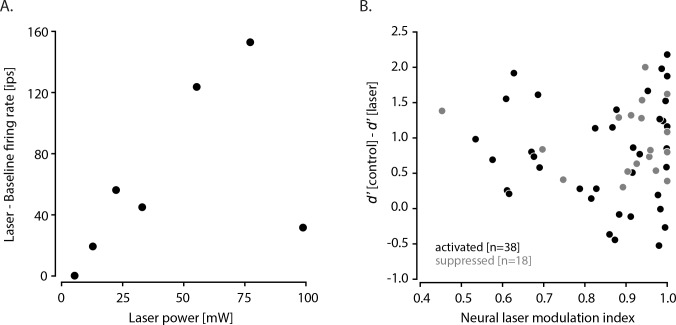
Figure 8—figure supplement 1. Correlation between optogenetic effects on neural activity and behavior.

Figure 8—figure supplement 1.

(A) Effect of laser power on firing rate across seven blocks from a single session. The difference in laser-evoked firing rate and baseline firing rate is plotted as a function of laser power. Behavioral effects for these blocks of trials are shown in Figure 8B. (B) Relationship between neurophysiological and behavioral effects at the activated (black) and suppressed (gray) sites during the Gabor contrast detection task. Neurophysiological effects were computed as the absolute value of the difference between laser-evoked and baseline firing rate, divided by the sum of two.
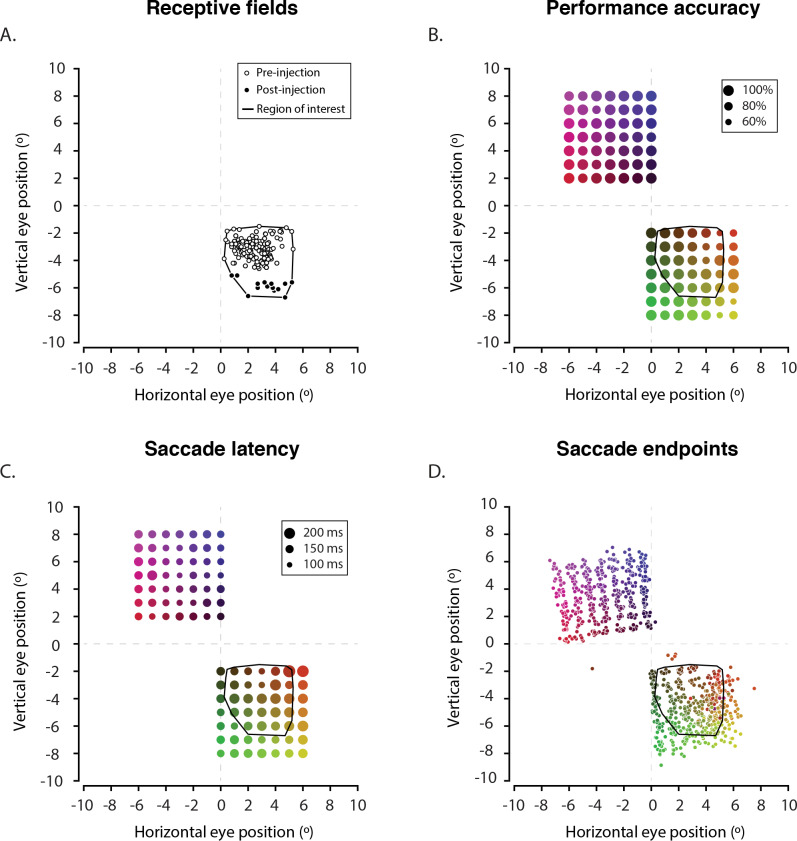
Figure 8—figure supplement 2. Analysis of visual sensitivity in monkey 2.

Figure 8—figure supplement 2.

The data in panels (B,C and D) were collected 840 days after the vector injections, and 663 days after the termination of optogenetic silencing experiments that contributed to the manuscript. (A) Electrophysiologically mapped receptive fields (RFs) before (unfilled circles) and after (filled circles) AAV injections into area V1. The polygon (black outline) enclosing all the RFs represents the region of interest where monkey’s visual sensitivity could be affected. (B) Saccade accuracy data from a visually guided saccade task. On each trial, a target appeared, the fixation point disappeared, and the monkey was rewarded for making a saccade to the target within ~300 ms. Targets were randomly drawn from two 7 × 7° grids (98 locations), one in the upper visual field and one in the lower visual field. (10 repetitions at each location). The size of each disk represents the proportion of saccades made to the corresponding target (landing within a 5 × 5° window). Each target location tested is plotted in a unique color which is preserved across panels. The monkey’s performance was ≥60% at all the tested locations. (C) Average saccade latencies are plotted as a function of target location. (D) Saccade end points are plotted as a function of target location in the unique color assigned to each location. Relative to saccades up and left, saccades down and right were less likely to be correct, had longer latencies, and were less accurate. The ‘shearing’ of the saccade end point distributions relative to the target positions is due to a small tilt in the infrared camera (SMI Inc, Hi-Speed Primate) relative to the eye.