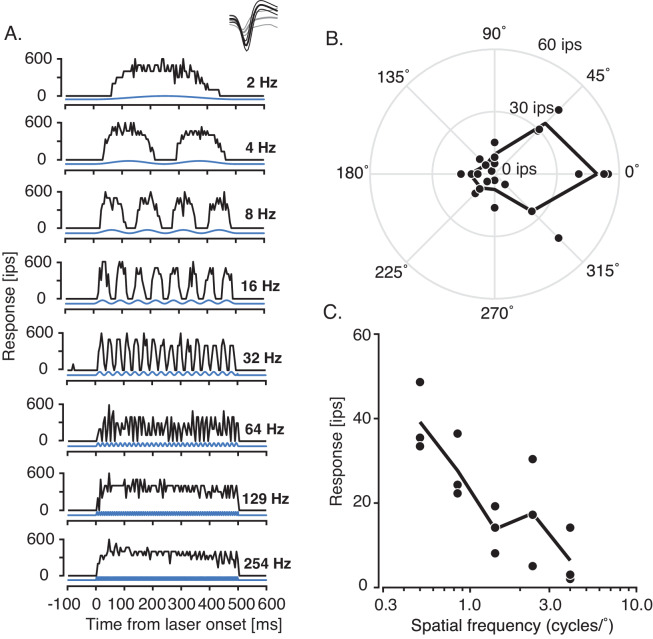
Figure 9. Responses of a putative GABAergic, direction-selective single unit to optical (450 nm laser) and visual (drifting achromatic 3 Hz sinusoidal grating) stimulation (A).
Peristimulus time histograms (black) in response to sinusoidal laser modulation from 2 Hz to 254 Hz (blue). Inset: Mean spike waveforms (thick black curve) and noise waveforms (thick gray curve) ± 1 standard deviation (thin curves). (B) Direction tuning curve showing individual (black points) and mean responses (black line) across repeated presentations of a drifting sinusoidal grating. (C) Spatial frequency tuning curve with symbols identical to (B).

