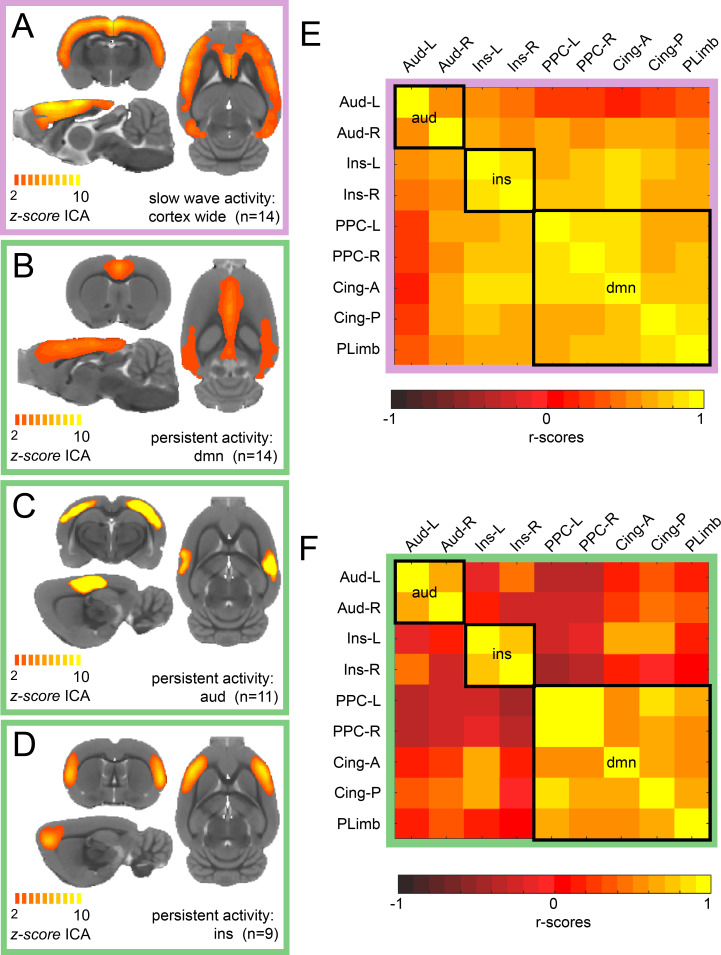
Figure 1. ICA reveals distinct components for slow wave and persistent activity.
(A) Average z-score maps of the cortex-wide component during slow wave activity. B-D. Average z-score maps of two components found in 14, 11 and 9 animals respectively (B Default mode network, C auditory component and D insula activation) during persistent activity. A detailed diagram with all the z-scores maps subject by subject can be found in Figure 1—figure supplement 1 (E) Resting-state functional connectivity matrix during slow wave activity from the nine regions of interest (ROIs) found in the ICA of persistent activity (B–D). Black squares outline the three networks. The ROIs are auditory cortex left and right (Aud-L, Aud-R), Insula left and right (Ins-L, Ins-R), posterior parietal cortex left and right (PPC-L and PPC-R), andterior and posterior cingulate cortex (Cing-A and Cing-P) and orbital/prelimbic cortex (PLimb). F. Same analysis as in E but for the signal obtained during persistent activity.


