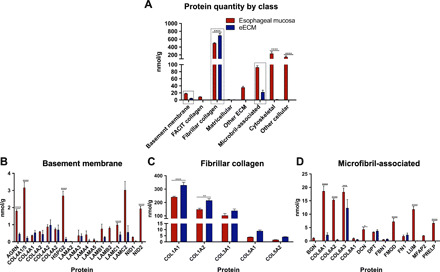
Fig. 3. Proteomic signature of eECM.

(A) Absolute quantification of ECM proteins, binned by gene ontology class, for native esophageal mucosa tissue and eECM. Data are means ± SEM (n = 3). Top classes of proteins that showed retention of ECM proteins in eECM compared to native esophageal mucosa tissue included (B) basement membrane, (C) fibrillar collagens, and (D) microfibril-associated proteins (boxed). Proteins within the gene ontology classes are further shown (B to D). *P ≤ 0.05, **P ≤ 0.01, ***P ≤ 0.001, ****P ≤ 0.0001 by two-way ANOVA for treatment and protein functional class or protein type, with post hoc multiple comparisons test.
