
Figure 3:
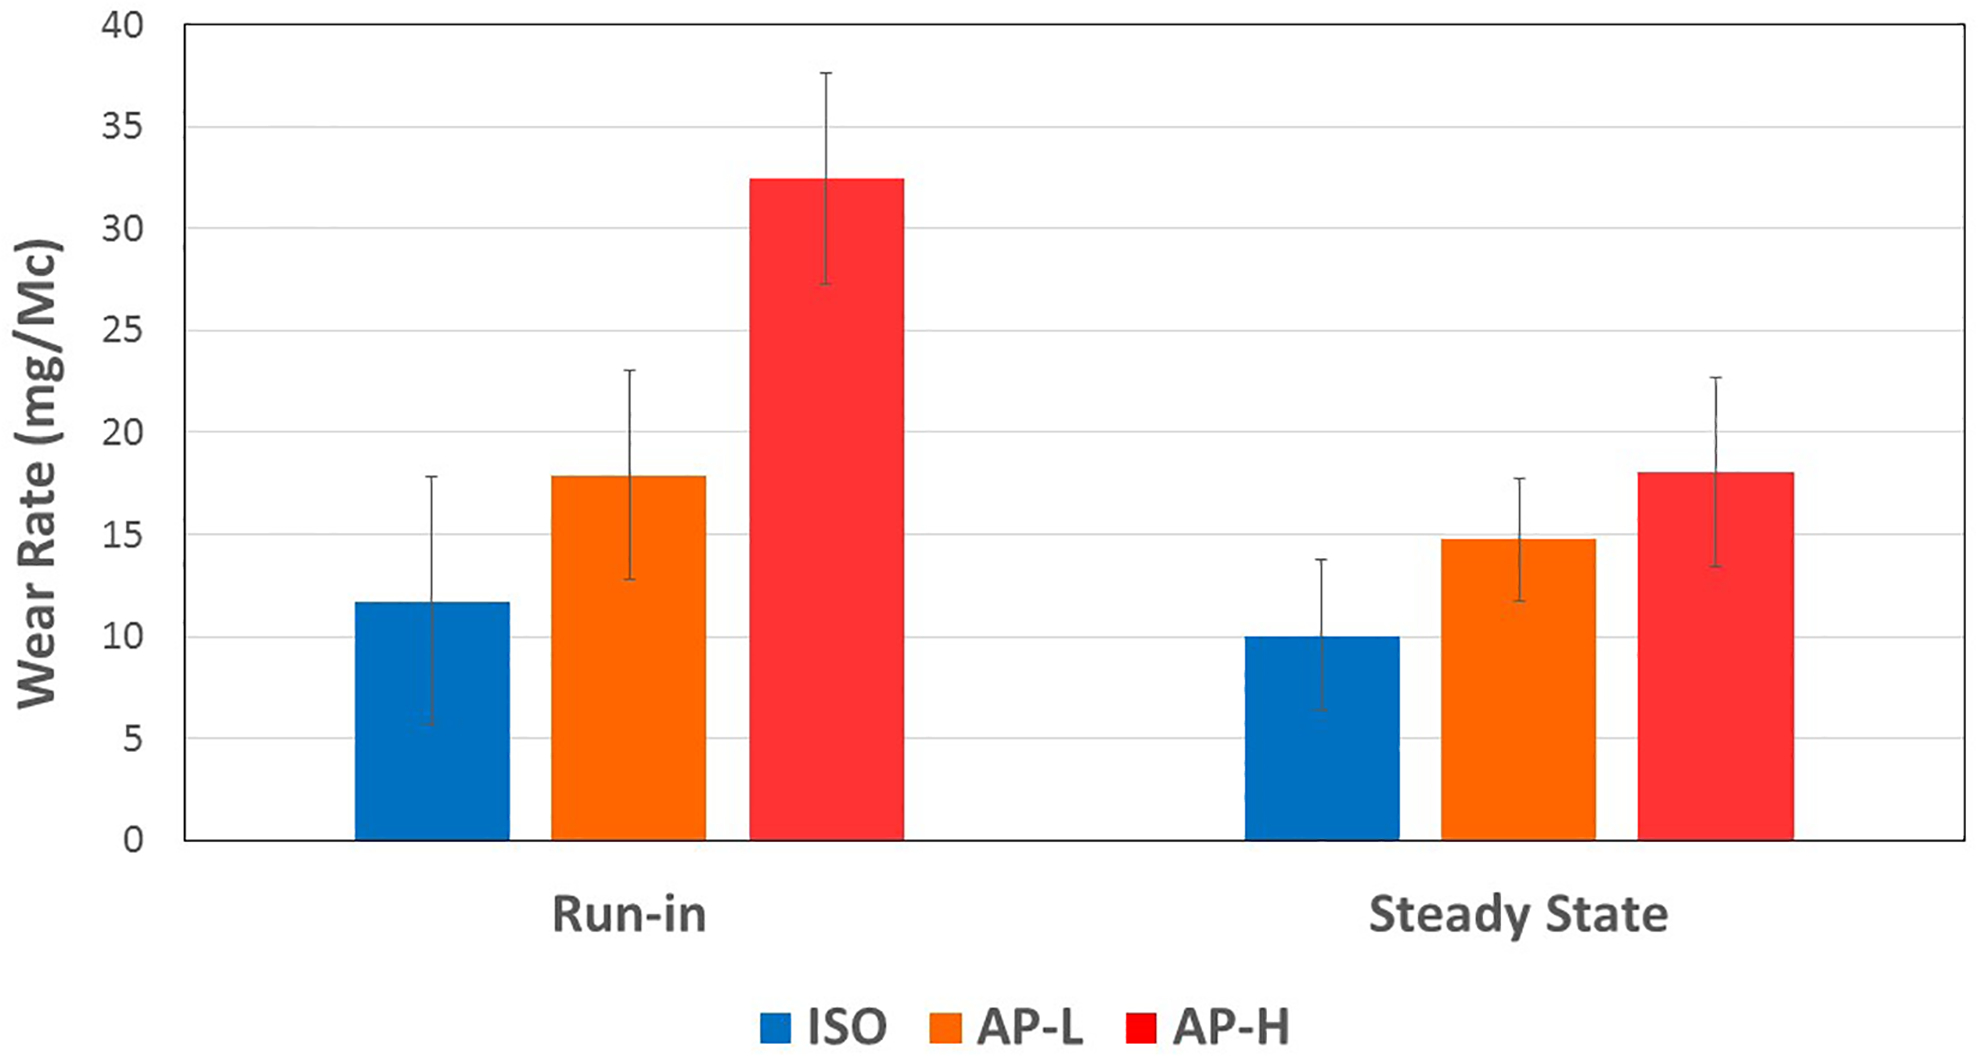
Mean run-in and steady-state gravimetric wear rates of ISO-D, AP L and AP H.
The error bars correspond to ± SE. They do not reflect the scatter for statistical comparisons across wear regimes (run-in, steady-state) and across motion protocols because of the paired design of experiment where the same inserts were used across all motion protocols. For statistical comparisons, this paired or blocked experiment design reduces the error term markedly below what is suggested by the error bars in this graph.