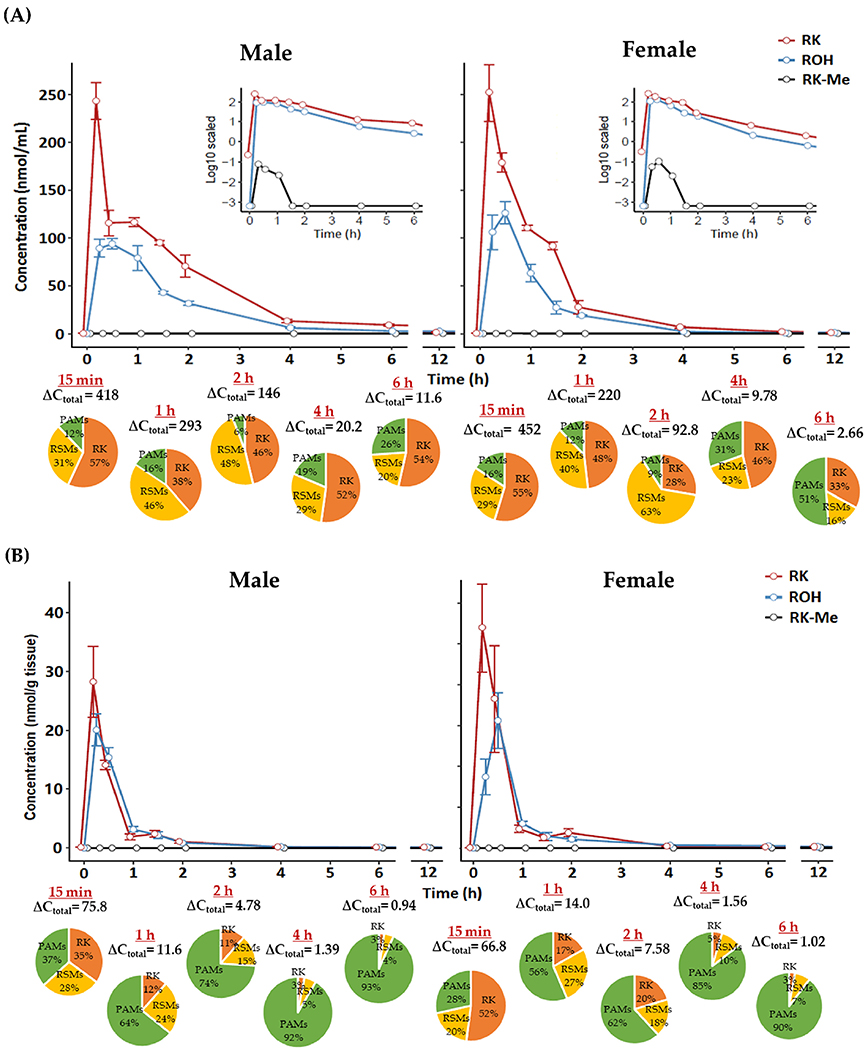
Figure 2.
Pharmacokinetic curves of raspberry ketone (RK), raspberry alcohol (ROH) and methylated raspberry ketone (RK-Me) in A) plasma (inset: concentrations in log scale) and B) brain in male and female mice dosed with RK; pie charts indicate profile of different phenolic categories (expressed as percentage of total phenols). ΔCtotal, net change in total phenol concentration versus baseline. Data are expressed as mean ± SEM (n = 3–5). RSMs, RK-specific metabolites; PAMs, phenolic acid metabolites.

