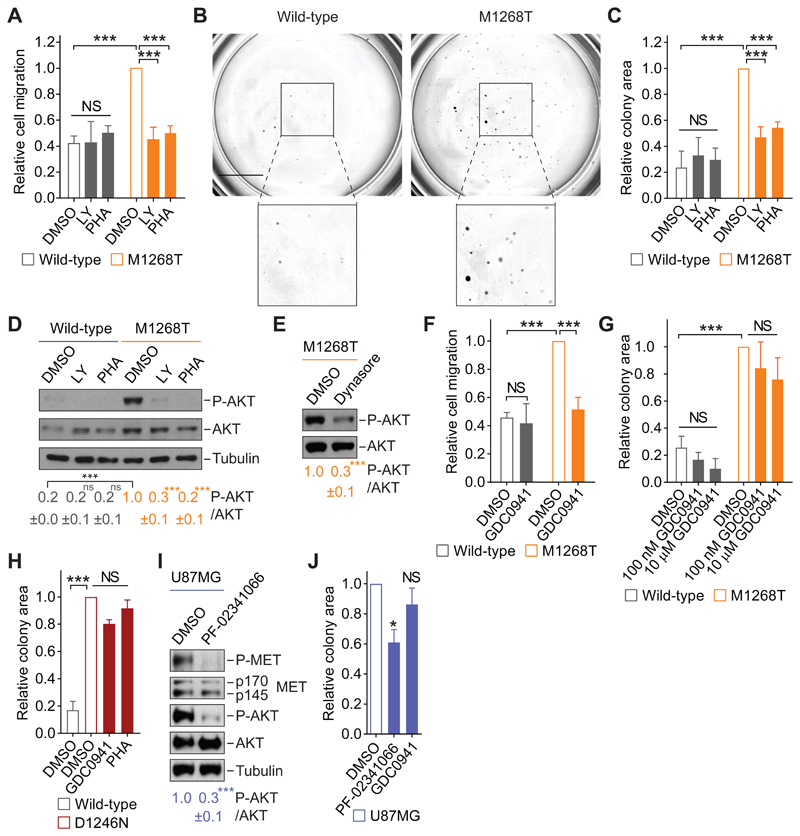
Fig. 1. Class I PI3K inhibition reduces MET-dependent cell migration but not anchorage-independent growth.
(A) Transwell migration assay performed with wild-type or M1268T MET-expressing NIH3T3 cells treated with DMSO, LY294002 (LY, 10 μM) or PHA-665752 (PHA, 100 nM). Data are mean ± SEM from N = 5 (DMSO), 4 (LY), or 3 (PHA) independent biological replicates. Student’s t test: NS, non-significant; ***P<0.005. (B and C) Colony formation assays in the cells described and treated as in (A) and grown in soft agar. Representative images are shown (B; scale bar: 5 mm), and the colony area was calculated by ImageJ (C). Data are mean ± SEM from N=3 independent biological replicates. Student’s t test: NS, non-significant; ***P<0.005. (D and E) Western blotting for phosphorylated (“P-AKT”, Ser473) and total AKT, with tubulin as loading control, in lysates from cells described and treated as in (A) or with dynasore (E; 80 μM). Below, mean densitometry of phosphorylated AKT relative to total ± SEM from N=3 independent biological replicates. Student’s t test (unless indicated, compared to control): NS, non-significant; ***P<0.005. (F and G) As in (A) and (C), respectively, in cells treated with DMSO or GDC0941 (F, 100 nM; G, as indicated). Data are mean ± SEM from at least 3 independent biological replicates. Student’s t test: NS, non-significant; ***P<0.005. (H) Relative colony formation by wild-type or D1246N MET-expressing cells grown in soft agar and treated with DMSO, GDC0941 (100 nM) or PHA-665752 (PHA, 100 nM). Data are mean ± SEM from N=3 independent biological replicates. One-way ANOVA test followed by Tukey’s multiple comparisons test: NS, non-significant; ***P<0.005. (I) Western blotting for phosphorylated (Tyr1234/1235) and total MET and AKT in lysates from U87MG cells treated with DMSO or PF-02341066 (100 nM). p170 and p145: the precursor and the mature forms of the beta chain of MET. Blots were analyzed as in (D and E). (J) Relative colony area of U87MG cells grown in soft agar and treated with DMSO, PF-02341066 (100 nM) or GDC0941 (100 nM). Data are means ± SEM from at least 3 independent biological replicates. Student’s t test (compared to control): NS, non-significant; *P<0.05.

