
Fig. 3.
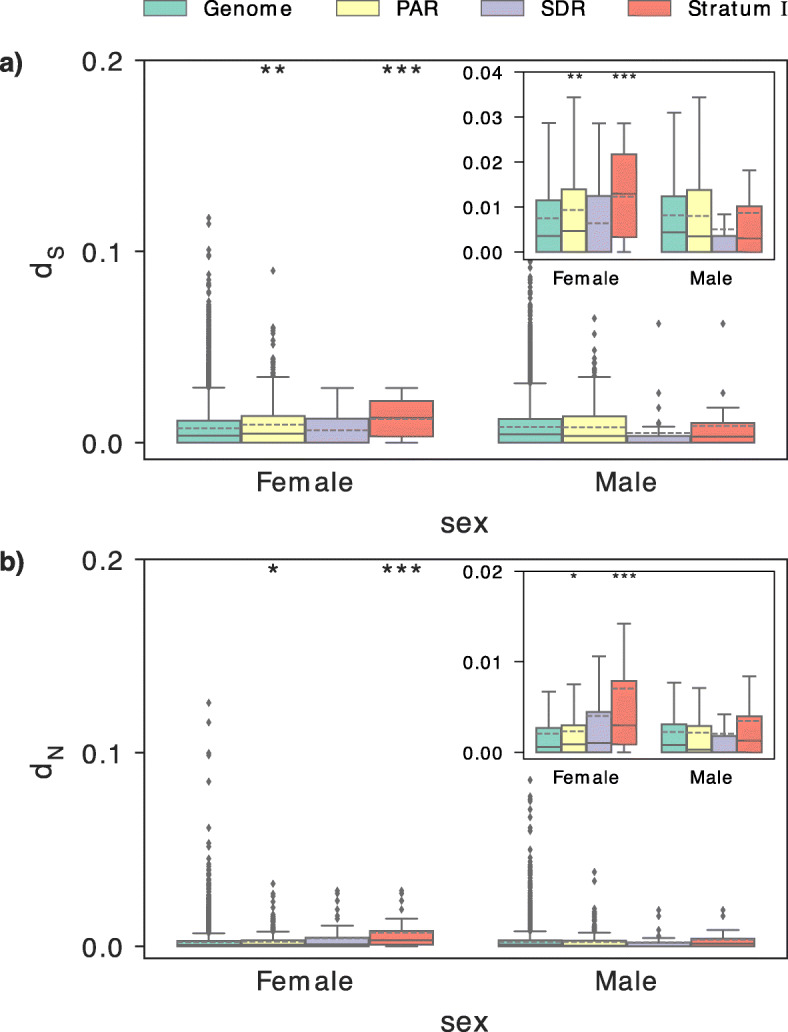
Comparison of polymorphisms at synonymous (dS) and non-synonymous (dN) sites. a Boxplots of dS estimates. b Boxplots of dN estimates. dS and dN were calculated based on the coding sequence alignment of phased diploid haplotypes from one female and one male individuals in the genome (excluding chromosome 15), the pseudo-autosomal region (PAR), the sex-determining region (SDR), and the more divergent stratum I. The inset plots show the quartile distributions of dS and dN estimates without outliers. Significant values from the Mann-Whitney U test relative to the genome are indicated with asterisks: *p < 0.05; **p < 0.01; ***p < 0.001