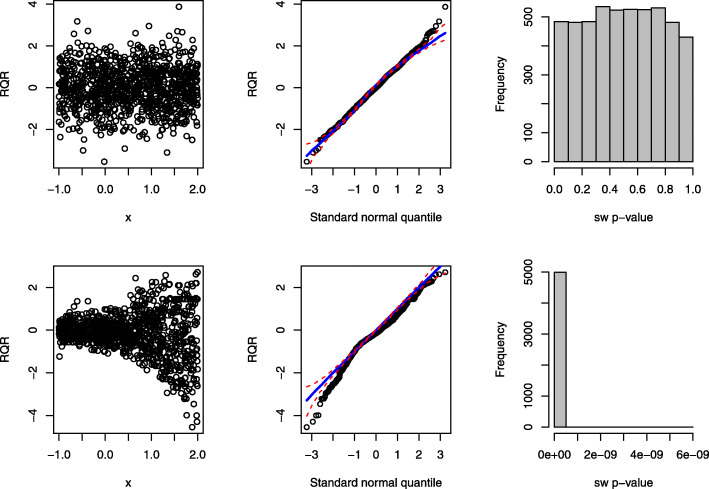
Fig. 6.
Performance of the RQRs in detecting over-dispersion of a sample dataset of size n=1000. The panels in the first row present the RQRs for the true fitted model: NB model. The panels in the second row present the RQRs for the fitted wrong model: Poisson model with the same mean structure as the true model. The first two columns display the scatter plots and QQ plots of the RQRs, respectively. The red dashed lines in the QQ plots represent the simulated envelopes. The third column presents the histograms of the SW p-values for the RQRs over 5000 randomly generated datasets from the true model

