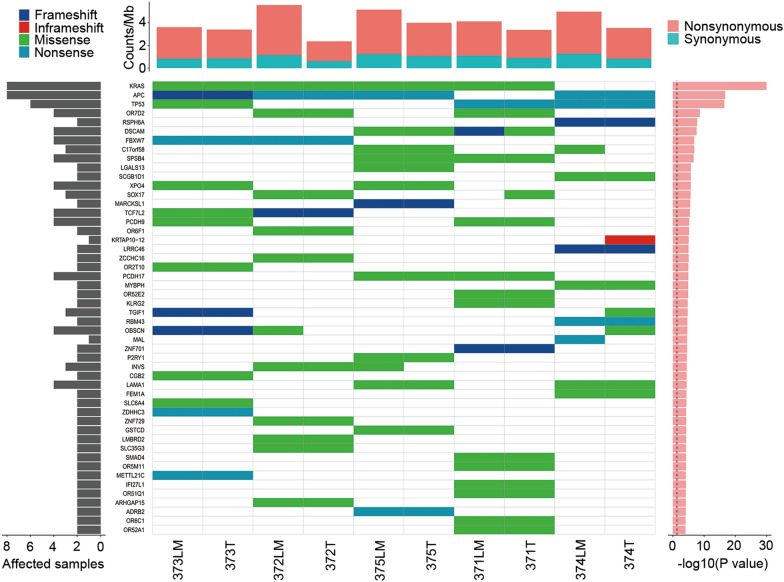
Fig. 3.
Significantly mutated genes (SMGs) in CRC patients with LM. The upper panel shows the gene mutation rate of each sample, calculated by number of mutations per megabase (Mb) of target sequence. Nonsynonymous (red) and synonymous mutations (green) were included. The central matrix shows SMGs and mutation types (represented by different colors as indicated in the upper left corner). Each column represents a single tumor lesion, and each row represents a gene. Patient ID is listed at the bottom of the figure. Blank grids indicate no mutations or no functional mutations in the corresponding gene of the sample. The grey bars on the left panel indicate the proportion of samples with mutated genes. The red bars on the right panel show SMGs ranked by − log10 P-value

