Fig. 1.

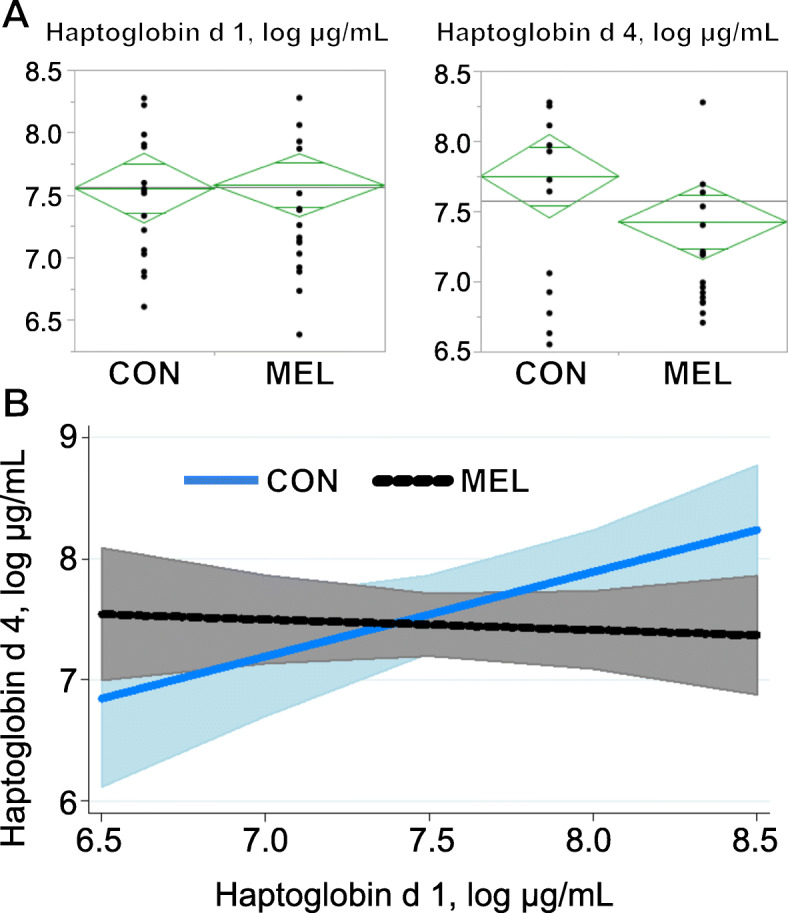
Baseline (d 1) haptoglobin relationship with d 4 haptoglobin is altered by meloxicam. a Log-transformed haptoglobin concentrations on d 1 (prior to treatment) and d 4 of lactation. The diamonds show means and 95% confidence intervals of the mean for each group. b Log haptoglobin concentration × treatment interaction (P = 0.04). Control ewes that had greater plasma haptoglobin concentration on d 1 had greater haptoglobin concentration on d 4, whereas initial plasma haptoglobin concentration on d 1 (before meloxicam) of treated ewes was not related to their d 4 values. D 4 haptoglobin concentration (log) = 8.10–0.09 × log haptoglobin covariate – 5.8[control] + 0.78 × log haptoglobin covariate[control]. Shaded areas represent 95% confidence intervals
