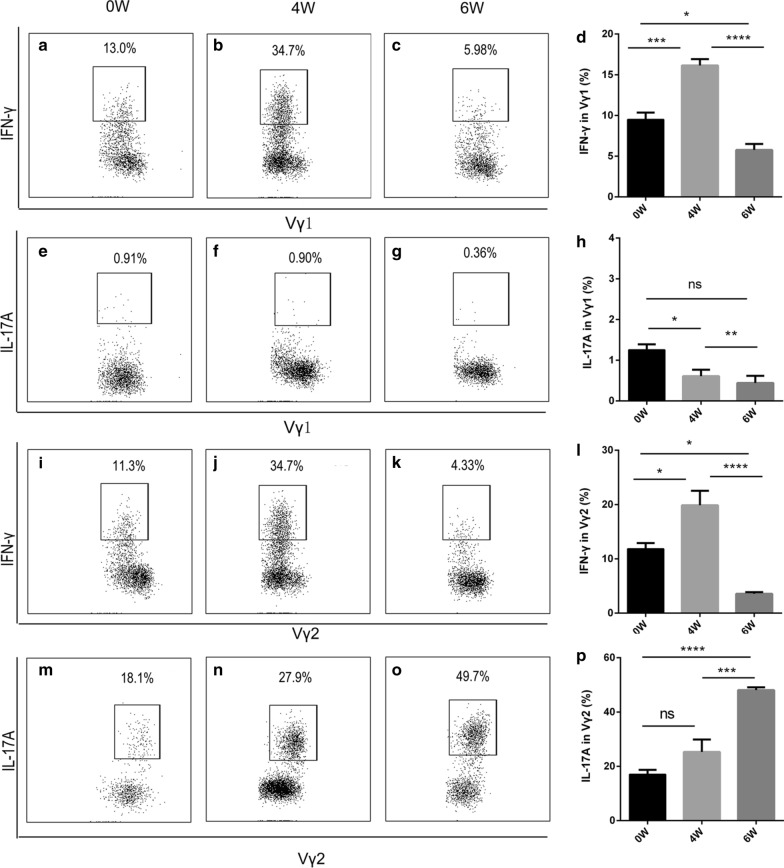
Fig. 2.
Vγ1 and Vγ2 cells secrete IFN-γ and IL-17A, respectively, in the liver. a-d Flow cytometric and statistical analyses of the percentage of IFN-γ from Vγ1 cells at 0 (a), 4 (b) and 6 (c) weeks post-infection. e-h Flow cytometric and statistical analyses of the percentage of IL-17A from Vγ1 cells at 0 (e), 4 (f) and 6 (g) weeks post-infection. i-l Flow cytometric and statistical analyses of the percentage of IFN-γ from Vγ2 cells at 0 (i), 4 (j) and 6 (k) weeks post-infection. m-p Flow cytometric and statistical analyses of the percentage of IL-17A from Vγ2 cells at 0 (m), 4 (n) and 6 (o) weeks post-infection. Liver leukocytes were stimulated with PMA (phorbol 12-myristate 13-acetate) +ionomycin for 4 h; intracellular IL-17A and IFN-γ staining were performed and representative dot plots are shown. The differences at 0, 4 and 6 weeks were analyzed using a one-way ANOVA, n = 5 per group, *P < 0.05, **P < 0.01, ***P < 0.001, ****P < 0.0001; ns, no significant difference

