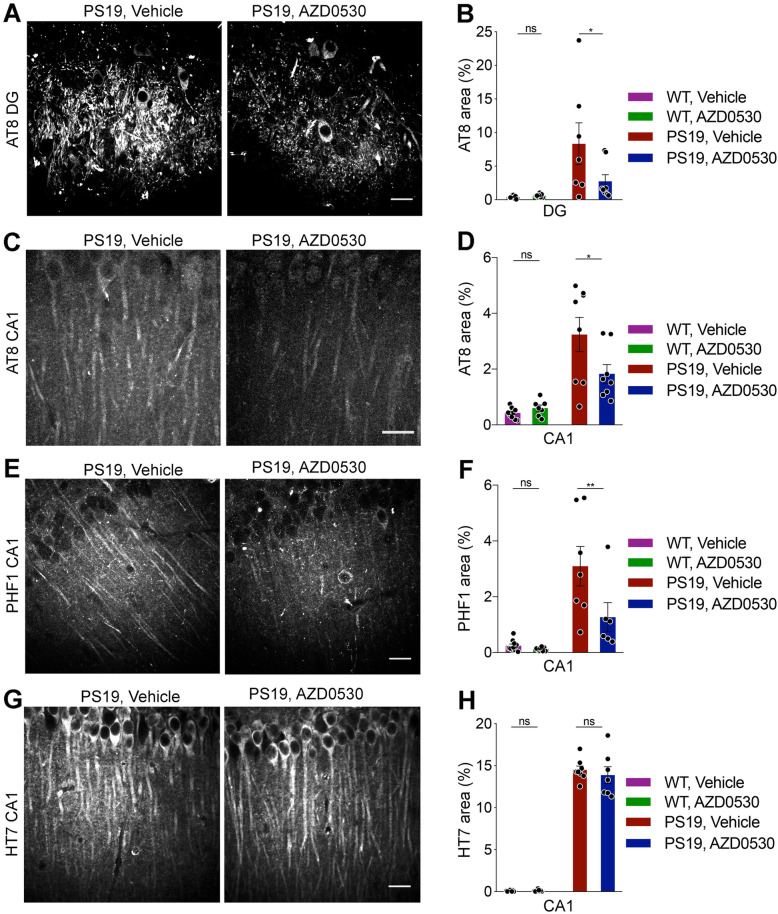
Fig. 2.
Reduced phospho-Tau Accumulation in Transgenic Mice Treated with AZD0530. (a) Representative images of AT8 immunoreactivity in the dentate gyrus (DG) of the hippocampus in 9-month-old PS19 mice after 7 months of treatment with AZD0530 or Vehicle. Scale bar, 20 μm. (b) Quantification of AT8-positive area (%) in the dentate gyrus of the hippocampus in 9-month-old PS19 and WT mice after 7 months of treatment. Data are mean ± SEM. n = 7–10 /group, each dot is the average of three sections from one mouse. Two-way ANOVA revealed an interaction between genotype and treatment (p = 0.0487). *p < 0.05; Sidak’s post hoc multiple comparisons test. (c) Representative images of immunofluorescent staining for AT8 in the CA1 of the hippocampus in 9-month-old PS19 mice after 7 months of treatment. Scale bar, 20 μm. (d) Quantification of AT8-positive area in the CA1 of the hippocampus in 9-month-old PS19 and WT mice after 7 months of treatment. Data are mean ± SEM. n = 7–10 /group, each dot is the average of three sections from one mouse. Two-way ANOVA revealed an interaction between genotype and treatment (p = 0.03). *p < 0.05; Sidak’s post hoc multiple comparisons test. (e) Representative images of immunofluorescent staining for PHF1 in the CA1 of the hippocampus in 9-month-old PS19 mice after 7 months of treatment. Scale bar, 20 μm. (f) Quantification of PHF1-positive area in the CA1 of the hippocampus in 9-month-old PS19 and WT mice after 7 months of treatment. Data are mean ± SEM. n = 6–10 /group, each dot is the average of three sections from one mouse. Two-way ANOVA revealed an interaction between genotype and treatment (p = 0.0341). **p < 0.01; Sidak’s post hoc multiple comparisons test. g) Representative images of immunofluorescent staining for HT7 in the CA1 of the hippocampus in 9-month-old PS19 mice after 7 months of treatment. Scale bar, 20 μm. (h) Quantification of HT7-positive area in the CA1 of the hippocampus in 9-month-old PS19 and WT mice after 7 months of treatment. Data are mean ± SEM. n = 7–9 /group, each dot is the average of three sections from one mouse. Two-way ANOVA revealed a main effect of genotype (p < 0.0001) but no interaction between genotype and treatment (p = 0.5181); Sidak’s post hoc multiple comparisons test

