Fig. 3.

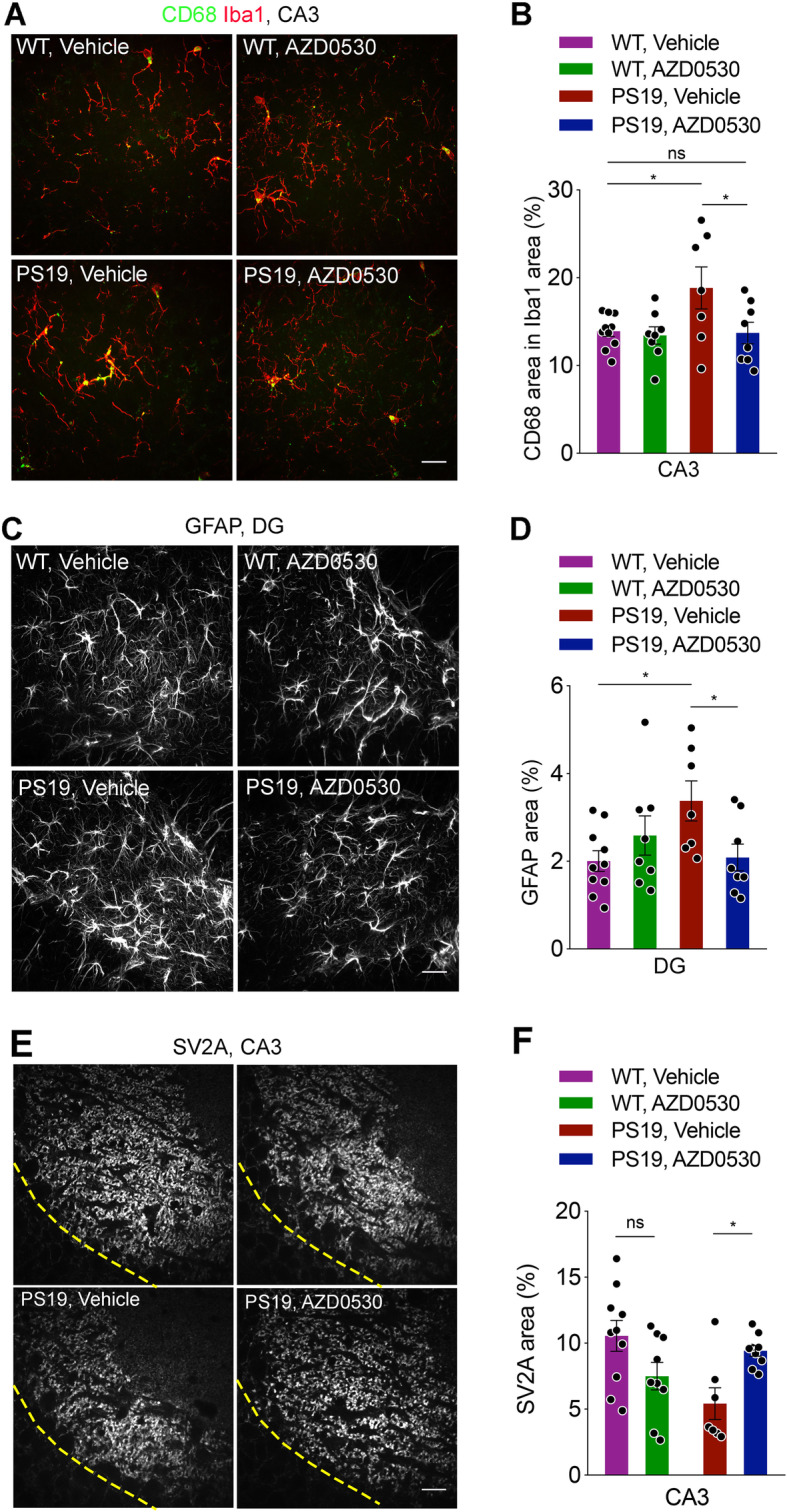
Chronic Fyn Inhibition Prevents Glial Activation and the Loss of Presynaptic Marker SV2A in Mutant Tau Transgenic Mice. (a) Representative images of CD68 and Iba1 double immunostaining in the CA3 region of the hippocampus from 9-month-old PS19 and WT mice after 7 months of treatment with AZD0530 or Vehicle. Scale bar, 20 μm. (b) Quantification of CD68-positive area (%) within Iba1-immuoreative area in the CA3 segment of the hippocampus from 9-month-old PS19 and WT mice after 7 months of treatment. Data are as mean ± SEM. n = 7–10 /group, each dot is the average of three sections from one mouse. *p < 0.05; One-way ANOVA with Dunnett’s multiple comparisons test. (c) Representative images of immunofluorescent staining GFAP in the dentate gyrus (DG) of the hippocampus in 9-month-old PS19 and WT mice after 7 months of treatment. Scale bar, 20 μm. (d) Quantification of GFAP-positive area (%) in the dentate gyrus of the hippocampus in 9-month-old PS19 and WT mice after 7 months of treatment. Data are mean ± SEM. n = 7–10 /group, each dot is the average of three sections from one mouse. *p < 0.05; One-way ANOVA with Dunnett’s multiple comparisons test. (e) Representative images of immunofluorescent staining for SV2A in the CA3 region of the hippocampus from 9-month-old PS19 and WT mice after 7 months of treatment with AZD0530 or Vehicle. Dashed lines represent the divide between the cell body layer and synaptic region. The cell bodies in the image were used to capture similar ROI from each section. Scale bar, 20 μm. (f) Quantification of SV2A-positive area (%) in the CA3 of the hippocampus in 9-month-old PS19 and WT mice after 7 months of treatment. Data are mean ± SEM. n = 7–10 /group, each dot is the average of three sections from one mouse. Two-way ANOVA revealed an interaction between genotype and treatment (p = 0.0015). *p < 0.05; Sidak’s post hoc multiple comparisons test
