
Figure 2:
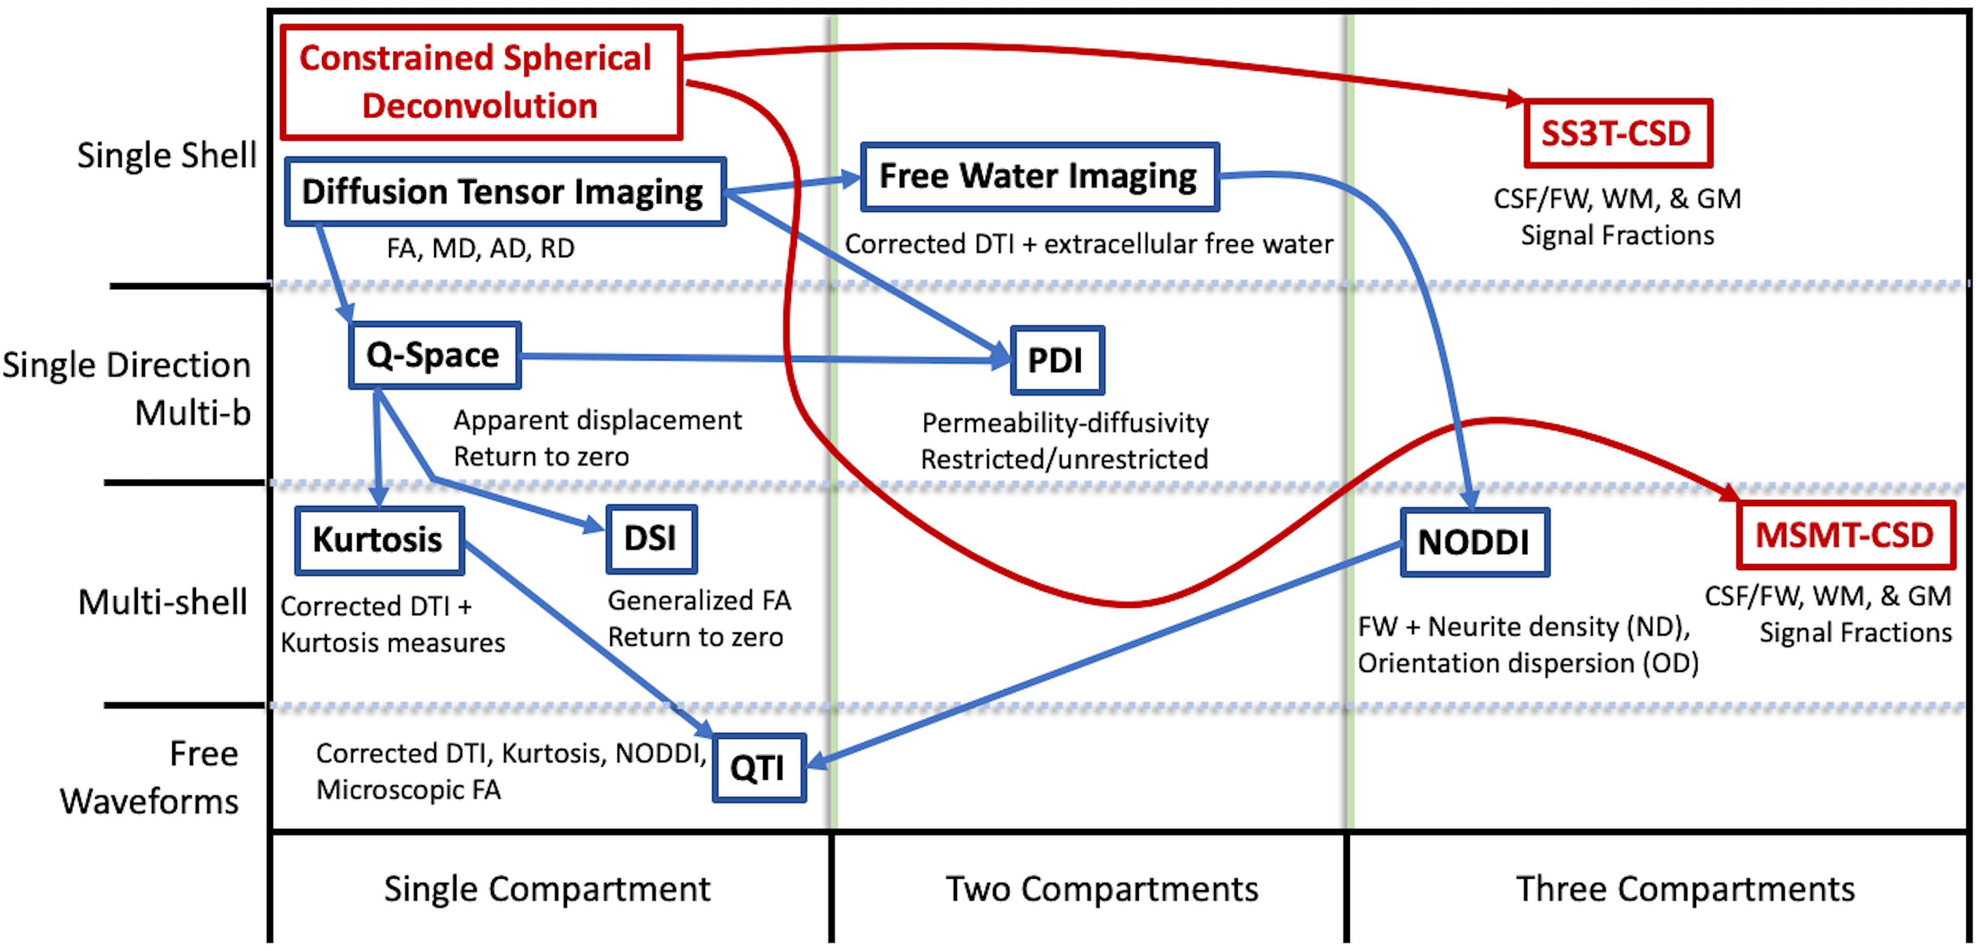
Chart adapted from Pasternak et al.(31); comparison of common DTI and other model metrics to CSD derived tissue signal fractions by requirements of acquisition (rows) and number of output compartments (columns). Methods derived from CSD have been added in red.