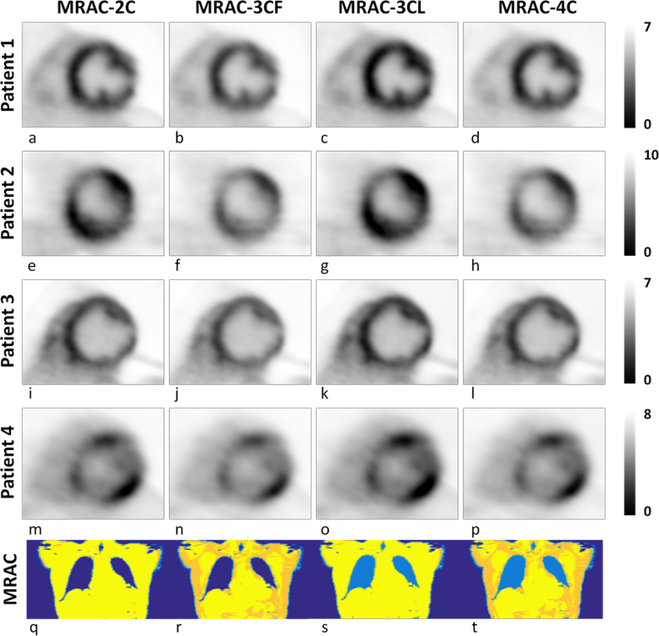
Fig 3.
Mid-ventricle short axis PET images for four patients reconstructed using different MRAC-type attenuation maps. The changes in appearance of the PET images, evaluated by the qualitative image analysis were minor. Patients 1 and 2 were designated differently depending on the MRAC type used: a)-c) Diffuse-symmetrical, d) focal-on-diffuse symmetrical; e) diffuse-asymmetrical, f)-h) focal; Patients 3 and 4 were designated with the same pattern regardless of MRAC-type: i)-l) focal-on-diffuse asymmetrical; m)-p) patchy. Representative (coronal) slices through the respective MRAC maps are also shown (q-t). Color represents linear attenuation coefficient and is segmented into tissue classes: soft tissue (yellow); fat (gold/orange); lung (bright blue); background air (dark blue).

