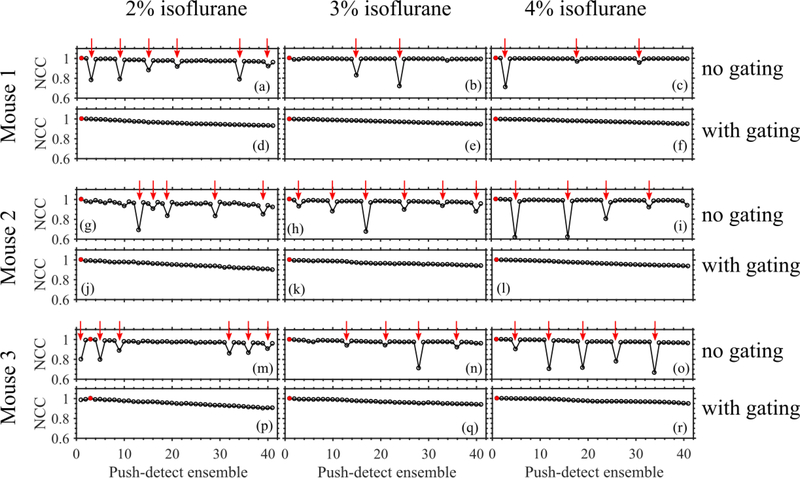
Fig. 4:
Illustrating the presence of motion in the SWE data from three free-breathing mice. The NCC profile was computed by performing cross-correlation between the first tracking frame (in B-mode form) of a motion-free push-detect ensemble (marked with a red circle) and the first frames of the remaining push-detect ensembles. The gated acquisitions exhibited smooth decay in the NCC profiles while the gating-free acquisitons exhibited reductions in temporal NCC. The push-detect ensembles with low NCC were identified (marked with red arrows) and used to isolate the corresponding motion-corrupted columns in the SWS maps (in Figure 5).

