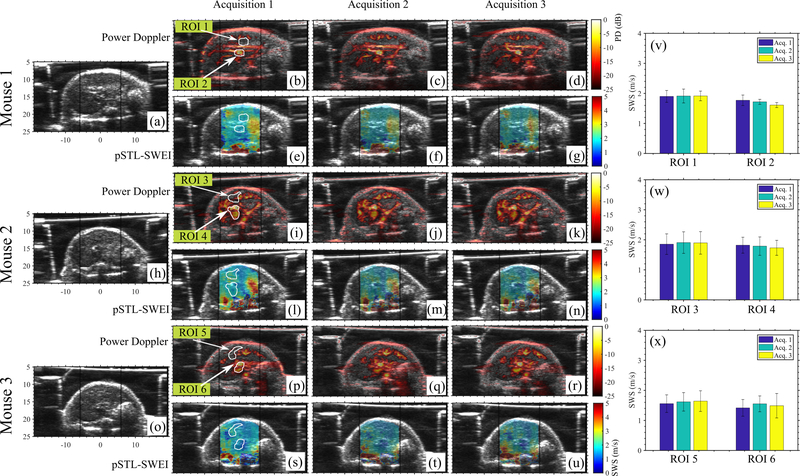
Fig. 6:
Shows the results of repeated acquisitions from three mice. B-modes, power doppler images and pSTL-SWE elastograms are shown for three mice in (a)-(u). To evaluate temporal variability, two ROIs were selected for each mouse: one within a relatively vessel-free region and one containing strong PD signal. The white arrows indicate the ROIs. The mean SWS within these ROIs over three acquisitions are shown in (v)-(x) for Mouse 1–3, respectively.

