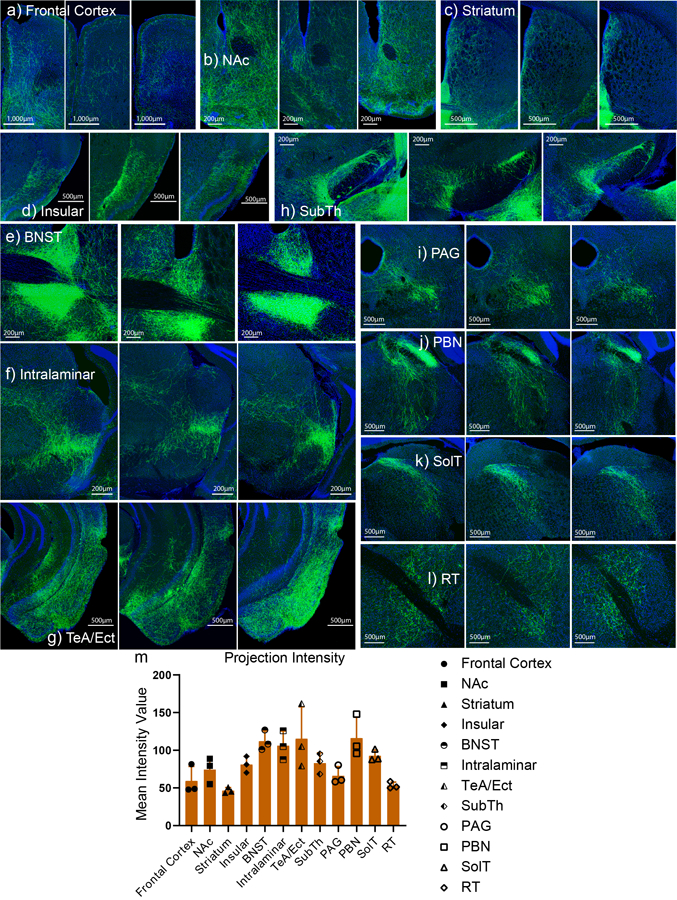
Extended Data Fig. 9. Consistent axonal projections from CeAGA neurons.

In sequential order: a) frontal cortex, b) nucleus accumbens (NAc), c) striatum, d) insular, e) bed nucleus stria terminalis (BNST), f) intralaminar, g) temporal association cortex (TeA) and ectorhinal cortex (Ect), h) subthalamic nucelus (SubTh), i) periaqueductal grey (PAG), j) parabrachial nucleus (PBN), k) solitary tract (SolT), and l) reticular formation (RT). m) Quantification of the mean intensity value (artificial units) of the axonal projections from each region of interest (ROI) listed above (a-l) (n=3 biologically independent samples) (59.40 ± 15.68 (FC), 74.38 ± 14.18 (NAc), 46.59 ± 3.21 (Striatum), 81.07 ± 8.86 (Ins), 112.09 ± 10.85 (BNST), 106.15 ± 15.69 (Intra), 115.35 ± 34.52 (TeA/Ect), 82.99 ± 11.06 (SubTh), 66.32 ± 9.84 (PAG), 116.29 ± 22.67 (PBN), 92.70 ± 6.27 (SolT), 53.26 ± 3.63 (RT)).
