
Figure 4 |. In vivo calcium imaging of CeAGA activities in sensory tests.
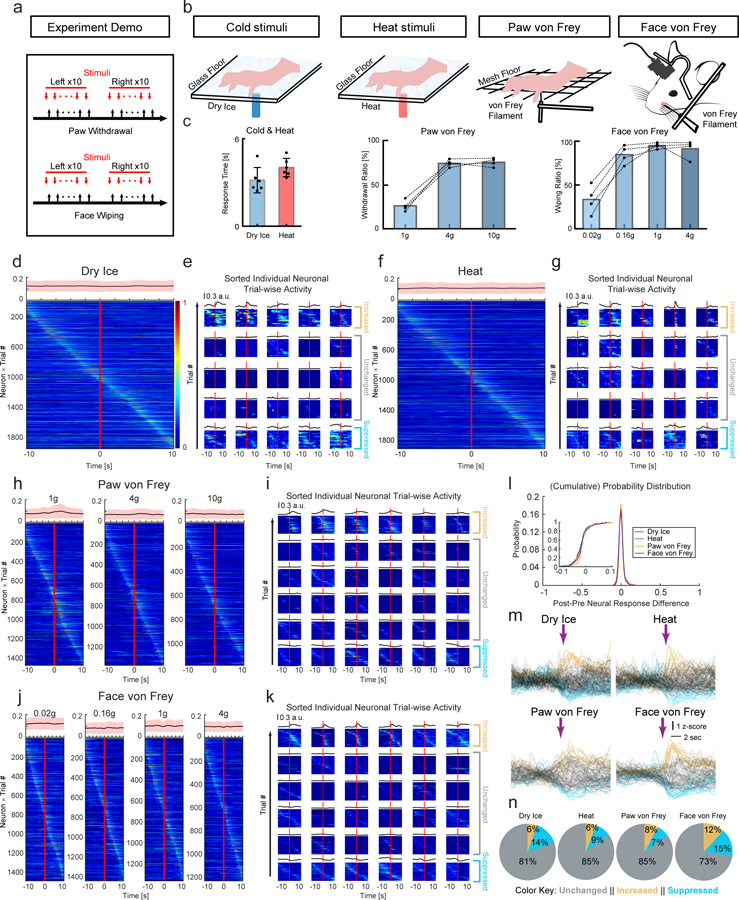
a, Scheme of nociceptive stimuli on the mice hind paws and facial pads. Red arrows, the onset of stimuli. Black arrows, the onset of withdrawal reflex responses.
b, Diagram showing calcium imaging of CeAGA neurons during cold, heat, graded von Frey stimuli applied to the hind paws in freely moving mice, or von Frey stimuli applied to the whisker pads in head-fixed mice.
c, Left, paw withdrawal latencies in response to dry ice (3.16 ± 0.36s) and heat stimuli (4.02 ± 0.26s) (n=6 animals). Middle, the percentage (%) of paw withdrawal in response to each filament of von Frey stimuli (n=4 animals (26.25 ± 3.17% (1g), 75.00 ± 2.08% (4g), 76.25 ± 2.43% (10g)). Right, the percentage of face wiping in response to each filament of von Frey stimuli (n=4 animals, 35.00 ± 8.42% (0.02g), 88.75 ± 5.54% (0.16g), 99.50 ± 1.71% (1.0g), 95.75 ± 5.31% (4.0g)). Data are mean ± s.e.m..
d, f, h and j, Neuronal activity patterns during d, cold stimuli, f, heat stimuli, h, von Frey stimuli to paws, and j, von Frey stimuli to facial pads sorted by neurons peak responses timing (from −10 to +10 sec, 0 is the onset of response, for those trials without response in the von Frey stimuli, 0 is the withdraw of von Frey filament). Top of each heatmap, averaged population activity. Thick lines indicated mean and shaded areas indicated s.e.m..
e, g, i and k, Three patterns of representative individual neuron responses plotted for all the trials to e, g, i and k sorted by neurons peak responses timing (from −10 to +10 sec). Mean response of each neuron was plotted on the top of each corresponding heatmap. l, Probability distribution (inset, cumulative probability distribution) of neural response differences between post- and pre-response to calcium signal intensity during the 4 sensory tests.
m, Averaged calcium traces of individual neuron’s responses to noxious stimuli. Individual trial response was plotted in either black (unchanged neurons), blue (suppressed neurons) and yellow (activated neurons).
n, Percentage of 3 response types of CeAGA neurons during 4 sensory tests.