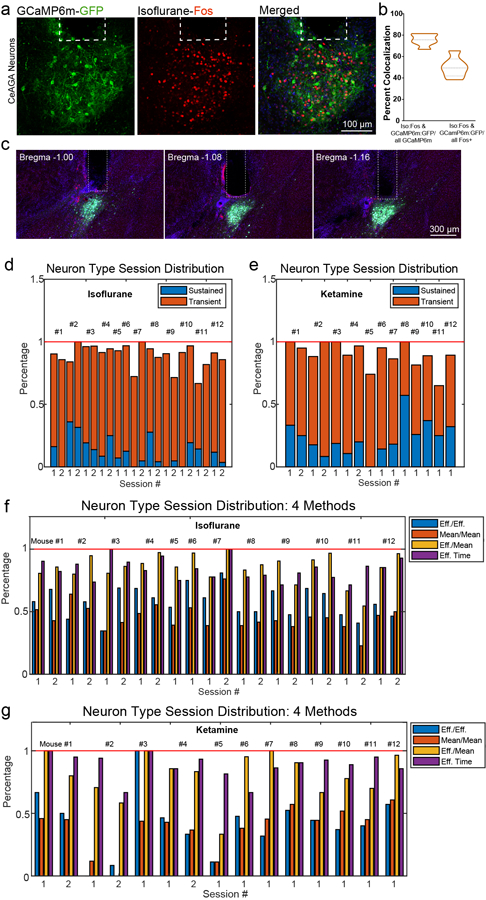
Extended Data Fig. 2. Representative post hoc histology and session distributions of activity of CANE-captured isoflurane-activated CeAGA neurons in response to isoflurane or ketamine.

a, Representative images of CANE-GCaMP6m+ neurons (green) and isoflurane-activated Fos+ neurons (red) and their overlap. Dotted box showing the placement of the GRIN lens in CeA. b, Quantification of the percent colocalization of Iso:Fos/all GCaMP6m (75.45±5.04%) and GCaMP6m:GFP/all Fos (50.1±8.70%) (n=6 animals). Data are mean ± s.e.m. c, Three consecutive representative images of post hoc histology showing optic fiber tract into the CeA from bregma −1.00 mm to −1.16 mm. Optic fiber diameter is 200 µm. d, Session-wise percentage distribution of iso.-sustained and iso.-transient neurons from Figure 2d. e, Session-wise percentage distribution of ketamine-sustained and ketamine-transient neurons from Figure 2f. f and g, Session-wise percentage distribution of the isoflurane-activated neurons (f), or the ketamine-activated neurons (g), calculated using four methods calculated based on the ratio between the post- and pre-stimulation (i.e. anesthetic administration) activity. Cyan, Eff./Eff., mean activity of (post-stim) effective time / mean activity of (pre-stim) effective time. Orange, Mean/Mean, mean activity of all the (post-stim) time /mean activity of all the (pre-stim) time. Yellow, Eff./Mean, mean activity of (post-stim) effective time / mean activity of all the (pre-stim) time. Purple, Eff. time, total (post-stim) effective time. “Effective time” refers to the time points of a neural trace whose intensity is two median absolute deviation above its mean. Only these time points were considered to compute the effective mean. See Methods for details of the 4 methods. Pre-, pre-stimuli, awake state (−4 – 0 min). Post-, post-stimuli, isoflurane or ketamine (0–20 min).
