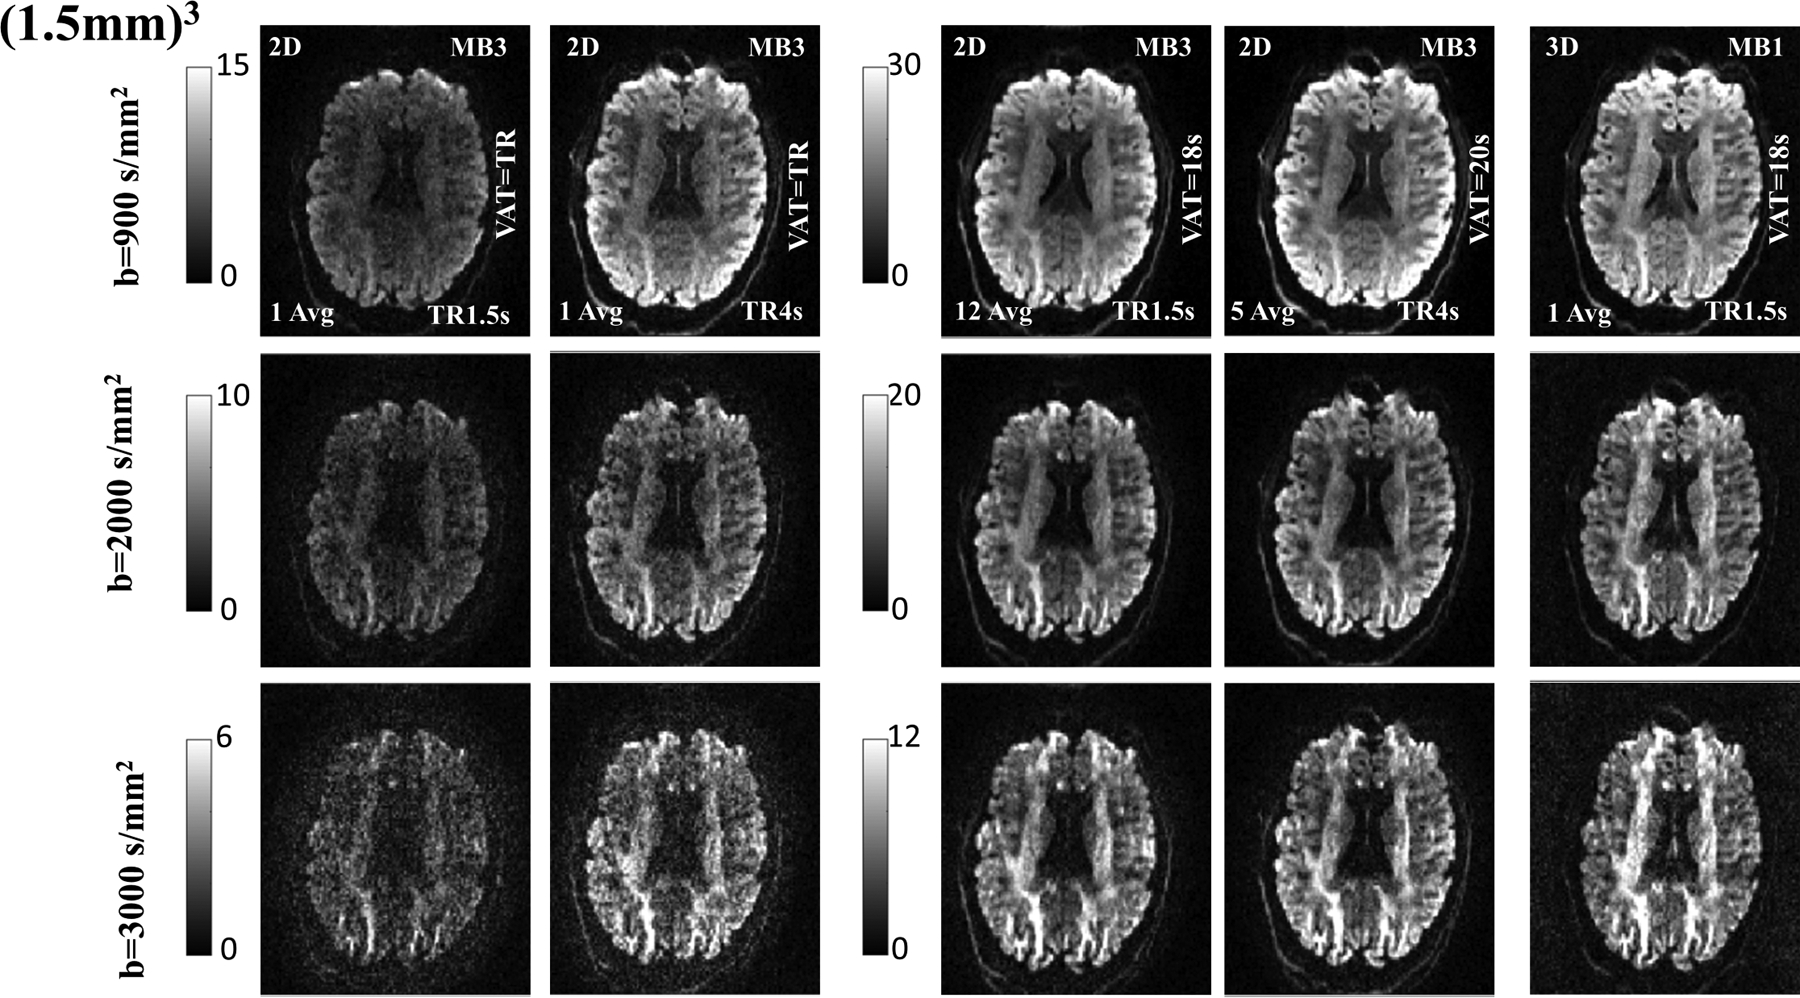
Figure 3:

Comparison of the SNR in a 2D and 3D acquisition for b=900, 2000 and 3000 s/mm2 at (1.5mm)3 isotropic resolution. The 3D multi-shot EPI in column 5 has a VAT=18 s (for a single volume) and acquired with TR of 1.5 s. This is compared with 2D acquisitions shown in column 3 with TR (and VAT) of 1.5 s and 12 averages for a VAT=18s and in column 4 with TR (and VAT) of 4 s and 5 averages for a VAT=20s respectively. Single average for 2D are shown in column 1 and 2 for TR=1.5s and TR=4 s respectively. The rows show the image SNR for b=900, 2000 and 3000 s/mm2 respectively. Note that the 2D approach with the MB=3 slice acceleration and TR of 1.5s cannot cover the entire brain and for whole-brain coverage a TR of 4s is required (using only MB=3). Gray-scale images are in absolute SNR units, and adjusted for each row, and for short VAT and long VAT respectively.
