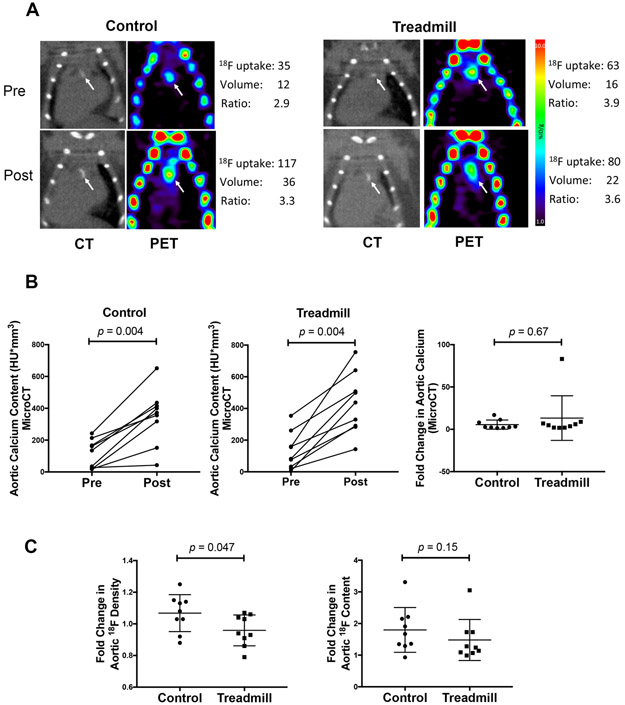
Figure 2: In vivo imaging analyses of the effects of exercise on aortic calcium deposits.
(A) In vivo imaging analyses of the effects of exercise on aortic calcium deposits. (A) Vascular calcium deposits (white arrows) imaged by microCT and microPET in control and exercise mice at the start (pre) and end (post) of the 9-week period. (B) MicroCT analysis of total aortic calcium content (left and middle) and fold change in aortic calcium content (right) over the intervention period. (C) MicroPET analysis of the fold change in the 18F-NaF density (left) and total 18F-NaF content (right) over the intervention period.

