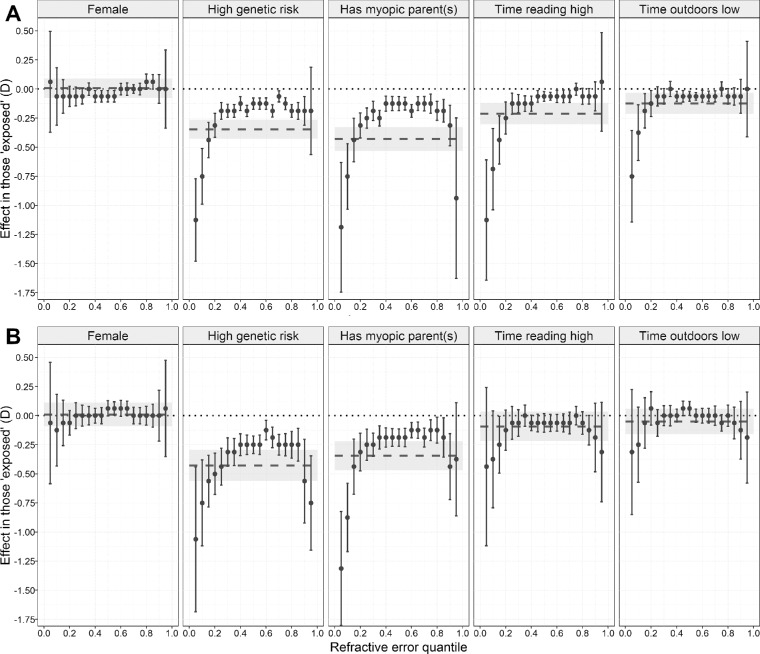
Figure 2.
Comparison of effect sizes associated with risk factor exposure estimated with OLS linear regression or with quantile regression. (A) Refractive error at the age 15 research clinic in ALSPAC participants. (B) Refractive error at the age 9 research clinic in Generation R participants. The dashed line indicates the effect size associated with exposure to the risk factor, calculated with OLS linear regression (95% confidence interval shown as gray shaded region). Filled circles correspond to the effect size associated with each exposure, calculated with quantile regression (error bars indicate 95% confidence interval). Note that effect sizes can vary across quantiles of the refractive error distribution for quantile regression.

