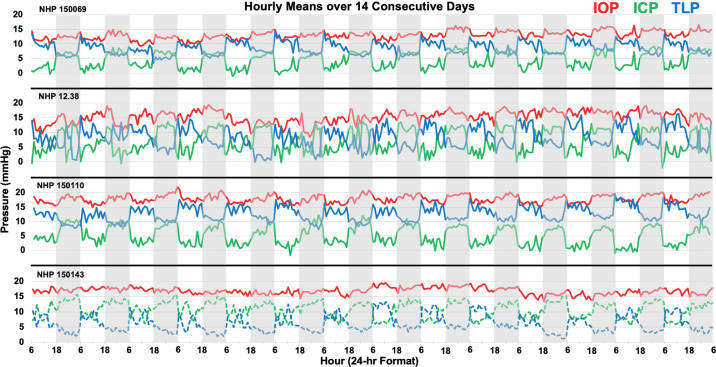
Figure 6.
Hourly mean pattern of IOP (red), ICP (green), and TLP (blue) in four NHPs over a randomly selected period of 14 consecutive days. Gray bars indicate the sleeping period (18:00–06:00). Note that ICP (dashed green) and TLP (dashed blue) are uncalibrated in NHP 150143 so absolute pressures are not valid, although relative diurnal differences in pressure are accurate.

