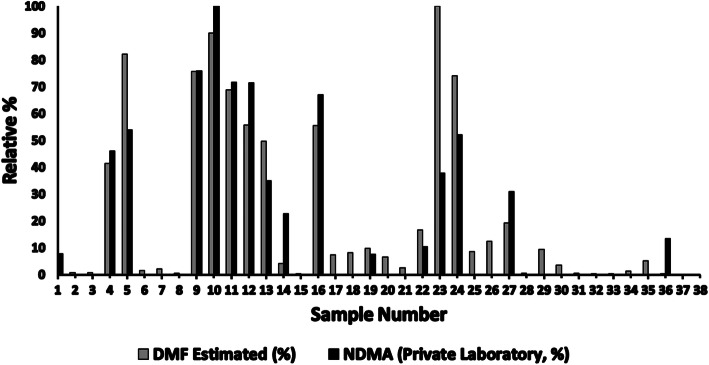
Fig. 2.
A plot of the relative percentage versus the sample number in the private laboratory samples. The relative percentages are from each value being divided by the highest value reported in the set by the private laboratory for NDMA (or zero where no amount was detected). Similarly, the relative amount of DMF in these samples (from FDA measurements) was plotted for the same samples. The results have a coefficient of determination of 0.81

