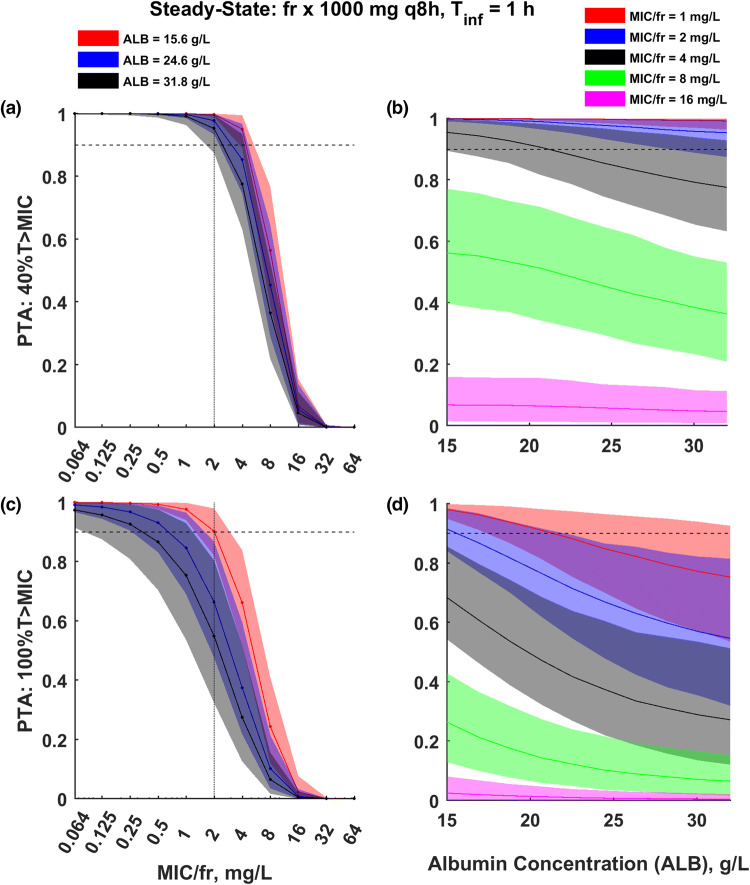
Fig. 4.
PTA of %T > MIC versus a, c MIC and b, d albumin concertation during the steady-state conditions observed after multiple dosing of meropenem at a 1000 mg q8h given as an 1 h infusion. The plasma concentration maintenance above MIC for a, b 40% and c, d 100% of the time during 24 h period was used as a target. The horizontal line denotes PTA of 90%. Colored dots, lines and shaded areas correspond to median and 90% CI of the PTA (bootstrap-based uncertainty intervals). fr (equal to Dose/1000) allows to calculate the PTA profile for different dose, i.e. fr = 2 corresponds to the dose of 2000 mg

