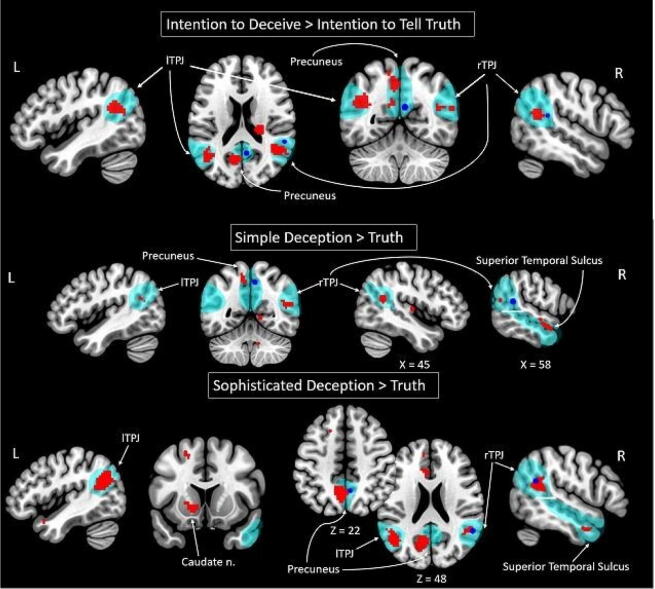
Figure 1.
Clusters of the increased BOLD signal associated with simple deception and sophisticated deception claims according to Bayesian inference are shown in red. Clusters reported by Volz and colleagues are illustrated as spheres in blue (radius = 4 mm; center = maximum coordinates of clusters, reported for identical contrast). The theory of mind network clusters are shown as thresholded maps from the group analysis of the contrast false belief > false photograph45 in teal (downloaded at https://saxelab.mit.edu/use-our-theory-mind-group-maps). L/R left/right hemisphere, g. gyrus, TPJ temporoparietal junction.

