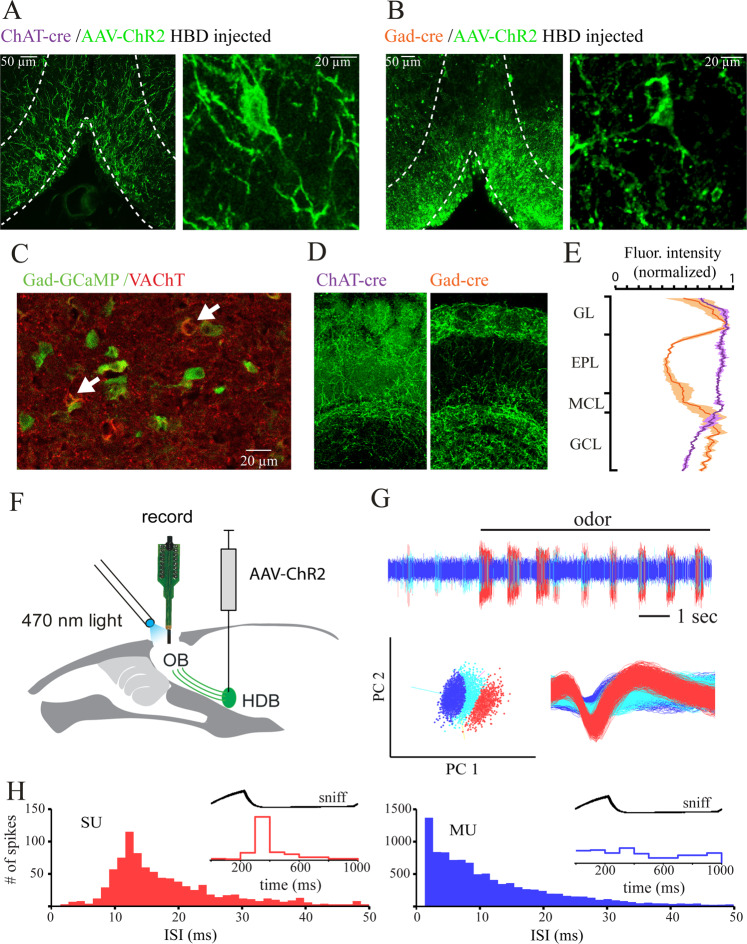
Figure 1.
Selective targeting of cholinergic and GABAergic inputs from basal forebrain to the OB. (A) Left, Coronal section (Bregma 0.74) through BF in a ChAT-Cre mouse injected with a Cre-dependent AAV-ChR2 virus. White lines indicate the outline of HDB and VDB. Right, Magnification of HDB showing labeled ChAT+ neurons. (B) Left, Coronal section (Bregma 0.74) through BF in a GAD2-Cre mouse injected with a Cre-dependent AAV-ChR2 virus. White lines indicate the outline of HDB and VDB. Right, Magnification of HDB/VDB showing somata of GAD + neurons. (C) Immunohistochemical staining of coronal sections of GAD2-Cre:GCaMP6 reporter mice (Bregma 0.74). Double labeled neurons are marked with white arrows. (D) ChR2-EYFP-expressing axon terminals in different layers of the OB 4 weeks after AAV-ChR2-EYFP injection into BF of a ChAT-Cre and GAD-Cre mice. GL: glomerular layer, EPL: external plexiform layer, MCL: mitral cell layer, GCL: granule cell layer. (E) Normalized fluorescence intensity profiles show that axons reaching the external plexiform layer are less prominent in GAD-Cre mice. (F) Schematic of experimental approach. See Materials and Methods for details. (G) Data acquisition. In continuous recordings, action potential waveforms with a signal-to-noise ratio of at least 4 SD above baseline noise were saved to a disk (sample rate 24 kHz) and further isolated using off-line spike sorting. The vertical line indicates onset of odorant stimulation. Isolation of waveforms into three different units by principal components 1 and 2 (bottom, left). Spike waveforms of the isolated units (bottom, right). (H) Inter-spike-interval histograms for two units. One is a single unit (SU) and one a multi unit (MU). Only single units were analyzed further. For units to be classified as presumptive MTCs also a clear sniff-modulation in sniff-triggered spike averages had to be present (inset).

