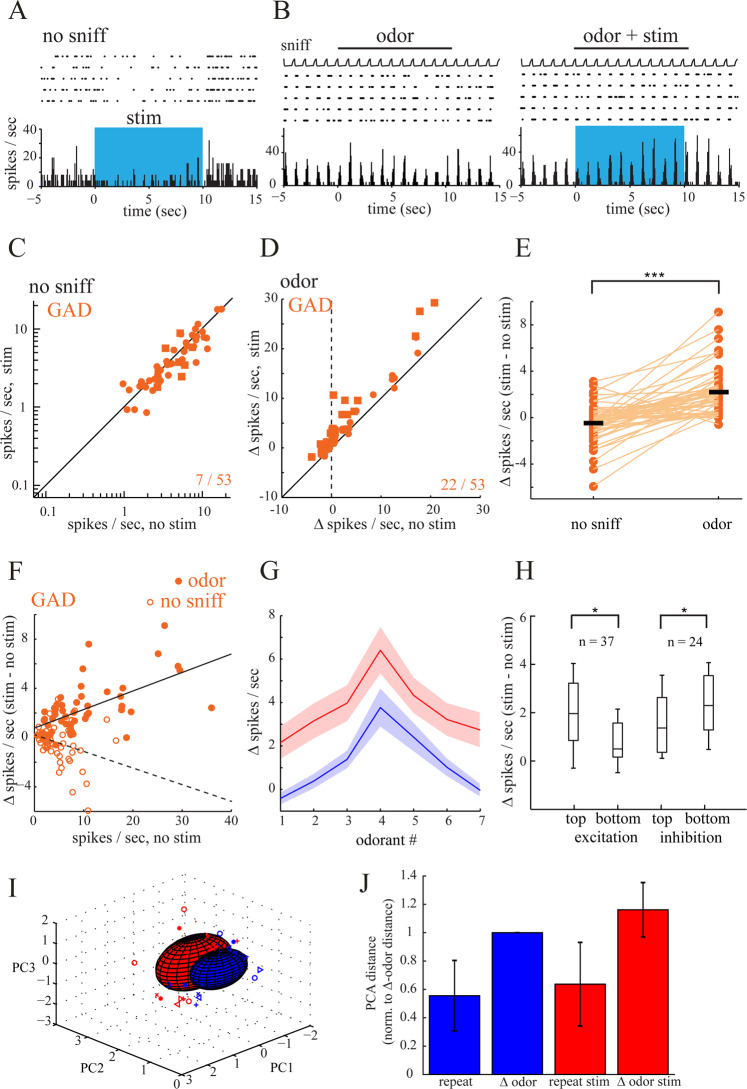
Figure 4.
Switch in modulatory effect between conditions in GAD-Cre mice. (A) Spike raster and rate histogram (bin width, 50 ms) depicting a spike rate decrease for a MTC during optical stimulation of the dorsal OB (“stim”, blue shaded area). (B) The same unit plotted in A was also tested in the odor condition. Odorant-evoked spiking is enhanced by optical OB stimulation in this unit. (C) Plot of spontaneous firing rate in the 9 s before (no stim) and during (stim) optical stimulation for all units tested in both the no-sniff and the odor condition (n = 53 units). Squares indicated significantly modulated units. (D) Plot of odorant-evoked spiking changes (∆ spikes/sniff) in the absence of (no stim) and during (stim) optogenetic stimulation of the same units tested in C. (E) Quantitative comparison of stimulation-evoked spiking changes (∆ spikes/sec) in the no-sniff and odor condition. Circles, spiking changes for individual units; black bars, mean value. Lines connect the same unit across conditions. (F) Optical stimulation effects in the odor condition were positively correlated to baseline activity (Pearson’s r = 0.61; two-tailed, p = 1.47 ×10⁻⁶). A negative correlation was observed in the no-sniff condition (Pearson’s r = −0.27; two-tailed, p = 0.05). (G) Effect of optical GABAergic OB fiber stimulation on odorant responses for MTCs tested with seven odorants. Blue, baseline response; red, response during optical stimulation. Odorants are ordered separately for each unit, with the strongest excitatory response in the baseline condition in the middle of the abscissa. Lines (±SEM) connect median responses across all tested trials. (H) Box plot comparing optically induced change in odorant-evoked spike rate (stim - no stim) for the strongest and weakest quartile of odorant-evoked responses taken from all cell–odorant pairs for excitatory as well as inhibitory responses. The box indicates median, 25–75th percentile ranges of the data, and whiskers indicate ±1 SD from the mean. (I) Representative PCA representation of OB response to odors with (red) and without (blue) OB HDB fiber activation. Symbols represent responses on individual trials to each odorant; ellipsoids are mean ± 1 SD. (J) Relative population response distances in neural activity space projected onto the first three principal components. Distances were normalized to the average ∆ odor distance. OB GABAergic fiber activation increases both variability in repeat and ∆ odor responses.

