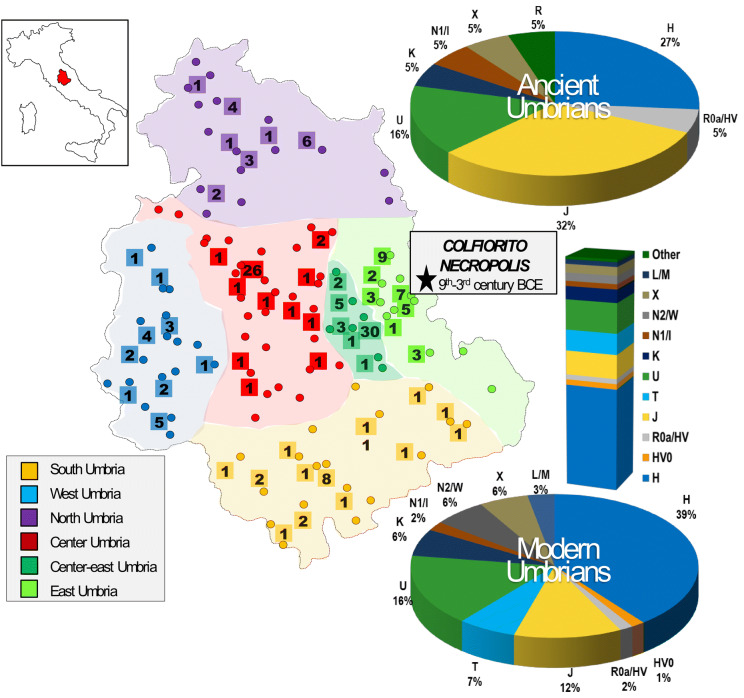
Figure 1.
Geographic origin of ancient and modern Umbrians analyzed in this study. The six established sub-regions are symbolized by different colors. Dots mark the geographic origin of all modern samples (N = 545, see Supplementary Dataset S1); those completely sequenced are reported in squares (N = 198, see Supplementary Dataset S2). Pie charts summarize haplogroup distributions (based on Haplogrep) considering complete mitogenomes of ancient (N = 19, see Supplementary Dataset S3) and modern samples, while the bar plot represents control-region data of the overall modern sample. The location of the Colfiorito necropolis is indicated by a star.

