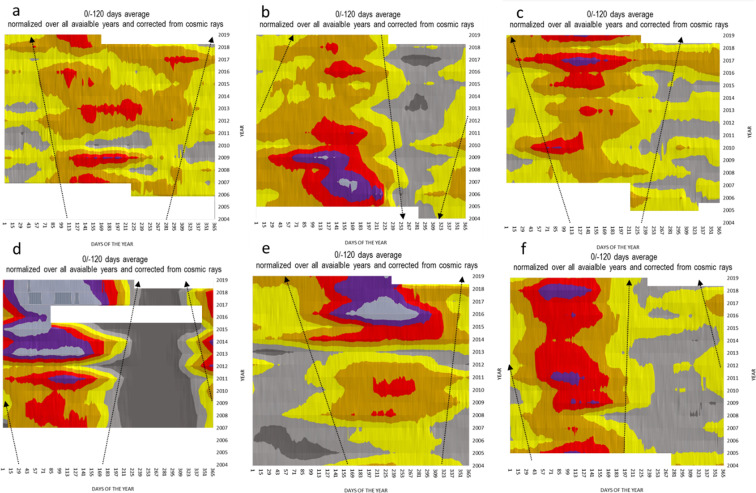
Figure 3.
Time series of the annual beryllium-7 concentration time series over the years at selected monitoring stations. Most long-term data sets of beryllium-7 concentration, like a, c, d, e, and f (Canada, Hawaii, Japan, Mongolia, Tristan da Cunha respectively), exhibited over the last two decades a broadening of the beryllium-7 season; i.e., the time period in which the beryllium-7 concentrations were above average. Some stations, like b in Florida and others in Zalesovo, Russia, and Rio de Janeiro, Brazil (not shown here), showed an opposing trend. Others like Cook Island and Guam (Pacific Islands located at low latitudes below 20 degrees) did not show much of a significant change over the past 16 years with a standard deviation of 5 to 6% for the whole time series. (supplementary file Table S1). The black arrows indicate the trends; they are only for visual guidance. White areas indicate periods of n/a data.

