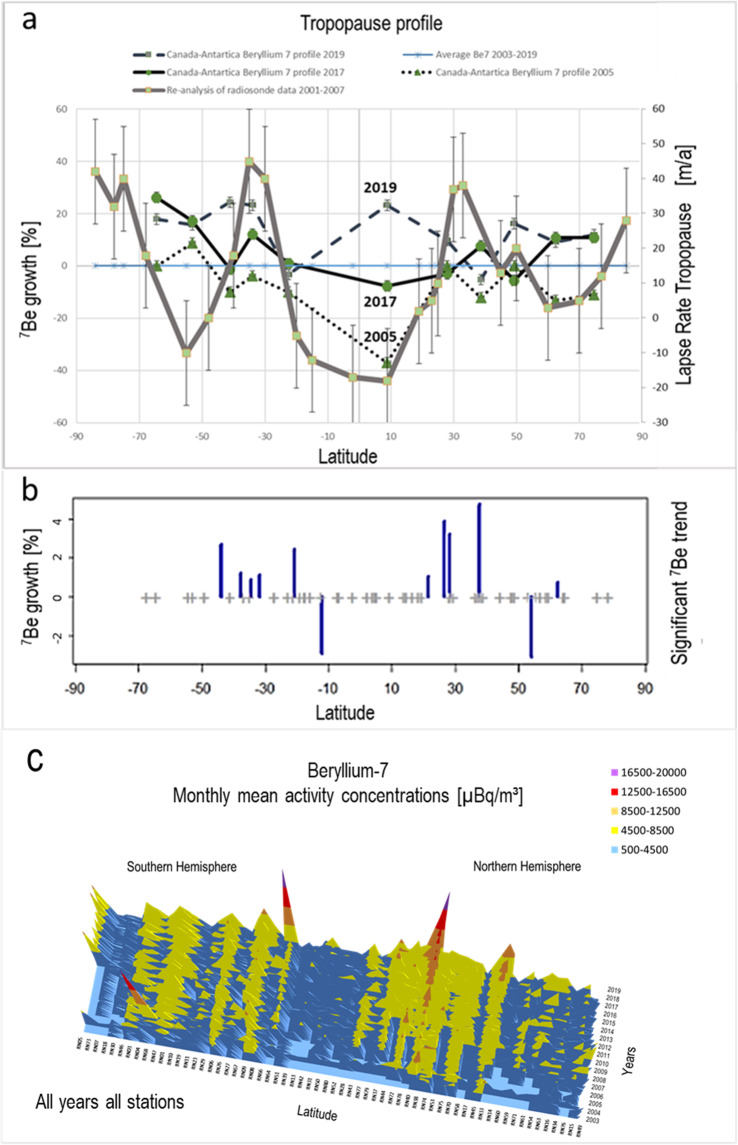
Figure 4.
(a) The relative increase/decrease of beryllium-7 concentrations for varying latitudes correlate with re-analysis measurements of the tropopause height trends. The beryllium-7 data was based on measurements from 2003 to 2019; the re-analysis data was based on aggregated measurements from 2001 to 2007 (Schmidt et al.)20. The applied error margin was 2% based on data uncertainties for the beryllium-7 concentration; for the re-analysis of the radiosonde data, it was ±15 m/a based on the aggregation of data in different latitudinal resolutions of 5°–10° (Schmidt et al.)20. The 2019 beryllium-7 profile is especially interesting because of its uncommon increase at the equator, possibly indicating a change in the tropopause profile and a connection to why hurricane Dorian (August 2019) was so powerful and slow at the same time. (b) Annual beryllium-7 growth for stations with significant (α = 0.05) trends (2004–2018). Plus signs indicate the position of all stations included in this study. (c) beryllium-7 monthly mean from all stations for all available years.

