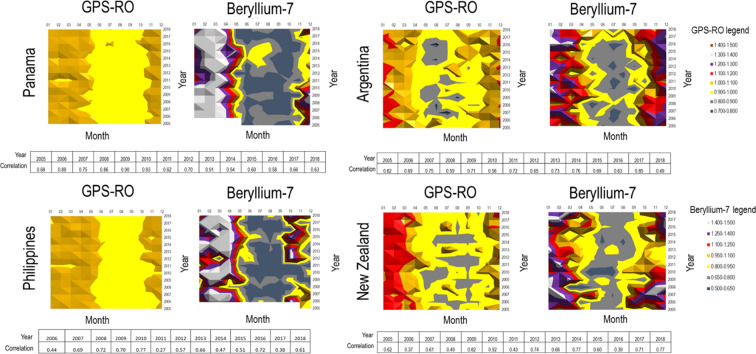
Figure 5.
Shows examples of IMS station locations from all regions of the worlds where we compared tropopause profile with beryllium-7 data. Tropopause profile is built on monthly average records of GPS-RO [m] (left plot) and beryllium 7[µBq/m³] (right plot). GPS-RO data have the same GPS coordinates as IMS stations locations. GPS-RO are retrieved temperature profiles generated by satellites. All available years are plotted. The coloured scale is based on normalised data obtained by dividing absolute values with the overall timeseries average. White areas indicate periods of n/a data.

