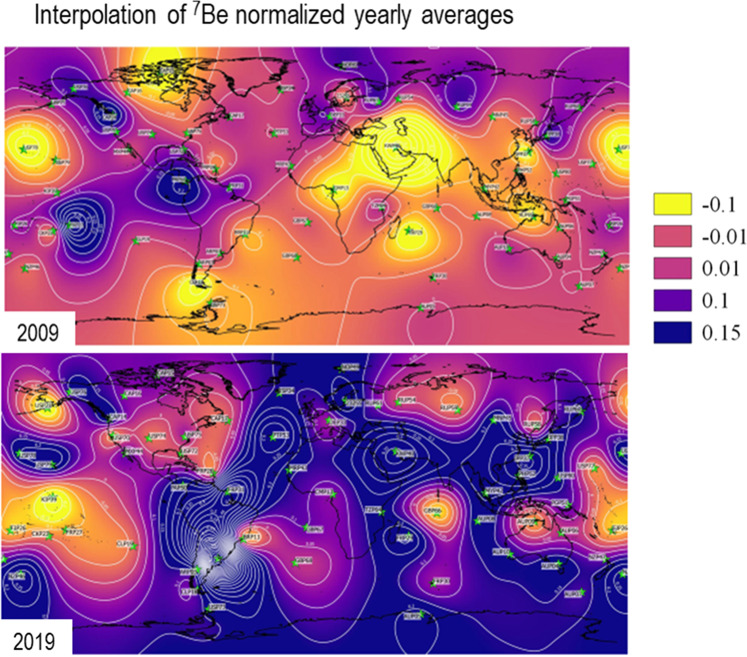
Figure 7.
Yearly normalized averages of beryllium-7 data for 2009 and 2019 corrected from cosmic rays. The interpolation does not contain meteorological information and is only to help visualize the global increase of beryllium-7 concentration in the last 10 years. Interpolation is based on multilevel b-spline with cell grid size of 1 degree using beryllium-7 values from 62 IMS stations (green stars). Software used to produce Figure 7 QGIS Development Team (2019). QGIS Geographic Information System. Open Source Geospatial Foundation Project. http://qgis.osgeo.org.

