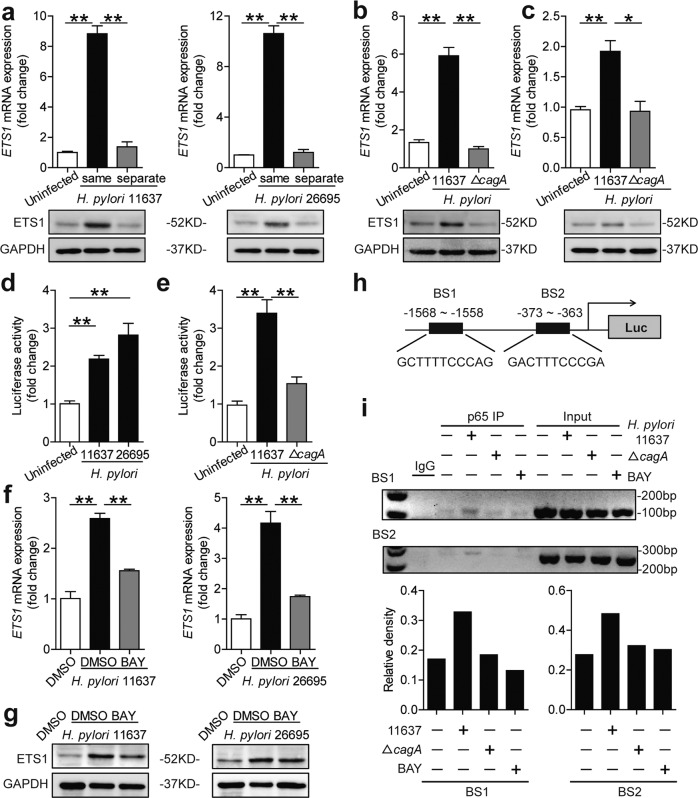
Fig. 2. The cagA activated NF-κB pathway-mediated ETS1 expression.
a AGS cells were either infected or not by H. pylori (MOI = 100) added in the same (lower) or separate (upper) chamber of a Transwell for 24 h. ETS1 mRNA and protein expression levels were analyzed by real-time PCR (n = 3) and western blot. b, c ETS1 mRNA and protein expression in H. pylori 11637- or ΔcagA-infected and uninfected AGS cells (b) or human primary GECs (c) (MOI = 100, 24 h) were analyzed by real-time PCR (n = 3) and western blot. d AGS cells were transfected with luciferase reporter constructs containing the ETS1-luc promoter for 4 h. Luciferase activity was measured to assess promoter activity after H. pylori 11637 or H. pylori 26695 infection (MOI = 100) for 24 h (n = 3). e AGS cells were transfected with luciferase reporter constructs containing the ETS1-luc promoter for 4 h. Luciferase activity was measured to assess promoter activity after H. pylori 11637 or ΔcagA infection (MOI = 100) for 24 h (n = 3). f, g AGS cells were pretreated with BAY 11-7082 (10 μM) and then infected with H. pylori 11637 or H. pylori 26695 (MOI = 100) for 24 h. ETS1 mRNA and protein expression were analyzed by real-time PCR (n = 3) and western blot. h The potential binding sites for p65 in the promoter of ETS1. i Chromatin immunoprecipitation (ChIP) assay in AGS cells infected with H. pylori 11637 (cells pretreated or not with BAY 11-7082 before infection) or ΔcagA, followed by regular PCR with primers designed for p65 binding site of ETS1 promoter region. The density of the bands was quantified and is shown on the below, and the column diagrams showed the “antibody group/input group” according to the results. * P < 0.05, **P < 0.01.

