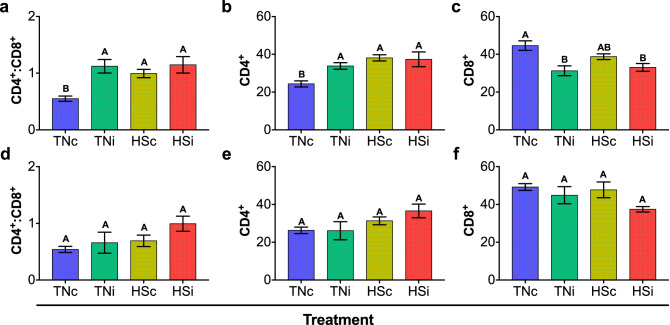
Figure 10.
T lymphocyte cell populations and ratio in the spleen of chickens infected with E. maxima and housed at thermoneutral (TNi; green) or heat stress (HSi; red) environment, as compared to uninfected chickens housed at thermoneutral (TNc; blue) or heat stress (HSc; yellow) environments. CD4+:CD8+ ratio at 7 dpi (a), CD4+ percentage at 7 dpi (b), CD8+ percentage at 7 dpi (c), CD4+:CD8+ ratio at 14 dpi (d), CD4+ percentage at 14 dpi (e), CD8+ percentage at 14 dpi (f). Data were analyzed by GLM procedure with multiple comparisons corrected with Tukey’s method at 5% level of significance (p < 0.05). Mean and standard error of the mean (SEM) are depicted. Significant differences between the groups are indicated by different superscript letters.

